P Bhoopathi, N Lee, A Pradhan, X Shen, S Das, D Sarkar, L Emdad, P Fisher (2016)
mda-7/IL-24 Induces Cell Death in Neuroblastoma
through a Novel Mechanism Involving AIF and ATM
Cancer Research, June 2016 76:12
mda-7/IL-24 Induces Cell Death in Neuroblastoma
through a Novel Mechanism Involving AIF and ATM
Cancer Research, June 2016 76:12
(Translated by Krishna Karamsetty)
Experiment: Experiment 5 - Cancer-terminating virus containing MDA-7 is increased by upstream molecules
|
This experiment was done to demonstrate that the power of the cancer-terminating virus containing MDA-7 was increased by the presence of upstream moleculesMolecules that start the process of cell death. Each of one the procedures were done three times in different cells linesCells grown from a singular cell therefore having the same genetic structure which produced the same results. The main DNA damage indicators are ATMATM serine/threonine kinase and H2AXH2A Histone family X. ATMATM serine/threonine kinase is a protein that activates DNA damage checkpoints. These activations stop the cell from further replicating leading to either DNA repair or cell death. In the case of this experiment, since MDA-7 had caused a series of events that cut the DNA strands, ATMATM serine/threonine kinase starts cell death. H2AXH2A Histone family X is a tumor suppressant gene that activates once, ATMATM serine/threonine kinase promotes it. Once H2AXH2A Histone family X has been promoted, it causes the formation of y-H2AX which can easily detected which can lead to cell death.
|
|
|
|
|
|
For Figure 5A, neuroblastoma cells in petri dishes were infected with either no viruses, the viruses that cannot replicate, the viruses that can replicate but, in all cells, regardless of cancer, and the viruses that can replicate only in cancer cells for 72 hours. After 72 hours, the lysateA collection of dead cells was collected and put through a Western Blot for DNA damage indicators. The first row shows one DNA damage indicator. Like all the other damage indicators, if the indicator was cut during cell death, then two lines would show up instead of one as shown here. This means that the cell was undergoing cell death and was boosted by those upstream moleculesMolecules that start the process of cell death. Same goes for DNA damage indicator 2. The different indicator is more strongly expressed under the column for virus + MDA-7 so this means that the power of MDA-7 was once again boosted by the upstream molecules.
|
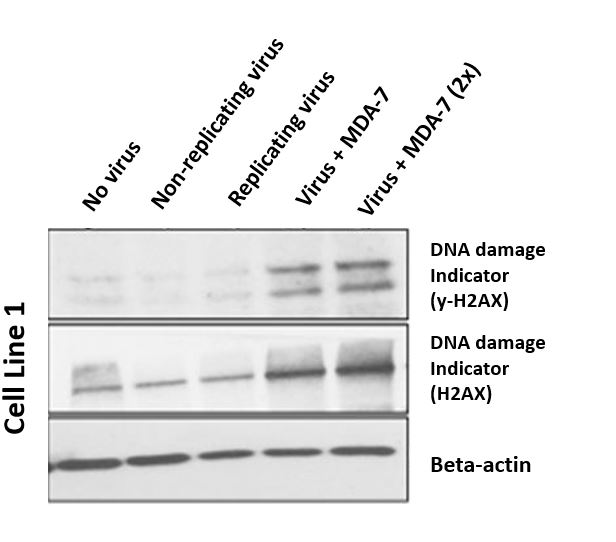
Figure 5A
|
|
|
|
|
For Figure 5B, the cells are infected the same way as 5A for 72 hours. Once the cells have been incubated, they are collected into a lysateA collection of dead cells and put through a Western Blot for the DNA damage indicators just like the last one. Just like the previous DNA damage indicator, this DNA damage indicator works just like the last one, causing DNA damage in order to cause cell death. Although all the rows have blots, the most strongly expressed blots are at the blots under the treatment of the virus with all parts. This means that the DNA damage indicators have helped MDA-7 cause cell death. This further supports the idea that these DNA damage indicators help MDA-7 kill the cancer cells.
|
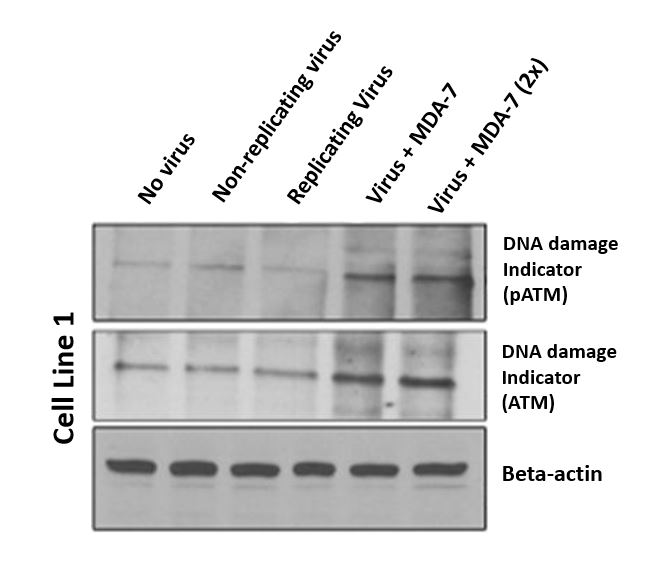
Figure 5B
|
|
|
|
|
For Figure 5C, the cells were exposed to either no viruses, viruses that can replicate regardless of whether or not the cell is cancerous and cells that can all only replicate in cancer cells for 48 hours. Also, before the cells were exposed to the virus, the cells were treated with a DNA damage inhibitor which should stop the two DNA damage indicators. The cells were collected after the 48-hour period and put through Western Blot for both DNA damage indicators, cell death inducing factors and the cell death indicator. Other than MDA-7, every row of blots has at least one blot for each column although they may be faint. MDA-7 is only present under the category, virus + MDA-7 which makes sense because this is the only treatment involving MDA-7. Both DNA damage indicators and the cell death inducing factors are more strongly expressed under the category, virus + MDA-7. The cell death indicator once again has two blots instead of one indicating that cell death has either happened or was happening. But when the normal treatment options were put together with the DNA damage indicator, DNA damage still happened but notice that the blots aren’t as thick as the others. This shows the researchers that all the proteins that were measured are essential in helping MDA-7 do its job properly.
|
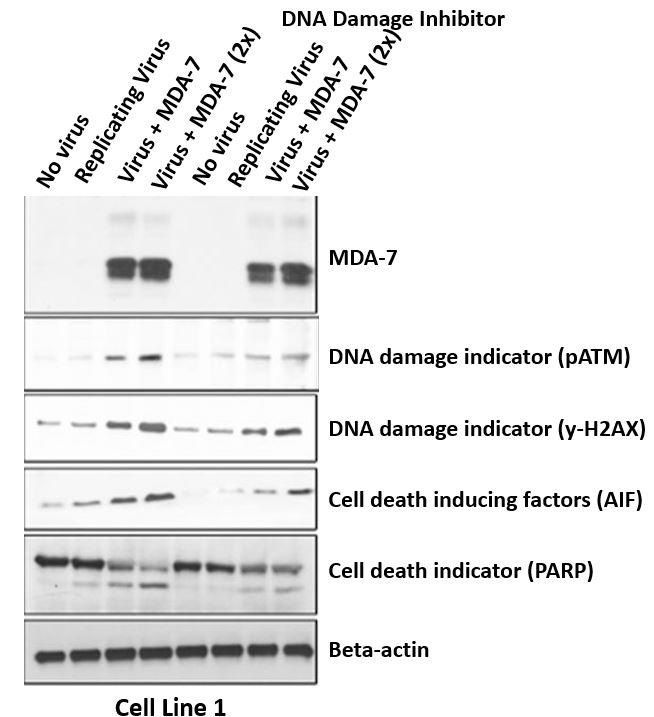
Figure 5C
|
|
|
|
|
For Figure 5D, the cells were exposed to either no viruses, viruses that can replicate regardless of whether or not the cell is cancerous and cells that can all only replicate in cancer cells for 48 hours. Also, before the cells were exposed to the virus, the cells were treated with a cell death inhibitor which should stop the process of cell death by stopping DNA damage regardless of the treatment. The cells were collected after the 48-hour period and put through Western Blot for the DNA damage indicators. Both lines have clearly seeable blots however the DNA damage indicator is only present where the virus is clearly replicating and introducing MDA-7 even when the cell death inhibitor is present. This indicates that when the virus infects cell with both the viral genes and MDA-7, the cell will start the production of the necessary proteins for cell death regardless of the inhibitor although it may take longer.
|
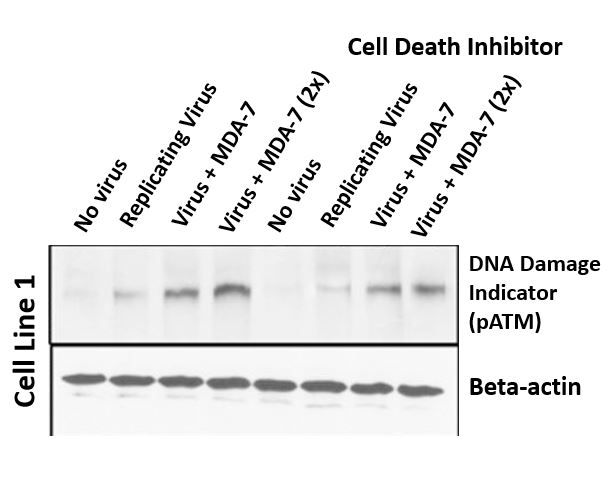
Figure 5D
|
|
|
|
|
For Figure 5E, the neuroblastoma cells were first treated with a DNA damage indicator and then exposed to either no viruses, viruses that can’t replicate, viruses that can replicate in all cells and only viruses that can only replicate in cancer cells for 48 hours. Afterwards, the cells were collected and run through a TUNEL assay for DNA damage. It is evident that when the cells were exposed to the virus with all parts, the number of cells with DNA damage increases exponentially however when the DNA damage indicator is present, there is still a lot of cell death, but not as much. This shows the researchers that even when the inhibitor is present, MDA-7 and to an extent the virus is still successfully killing the cells but at a slower rate.
|
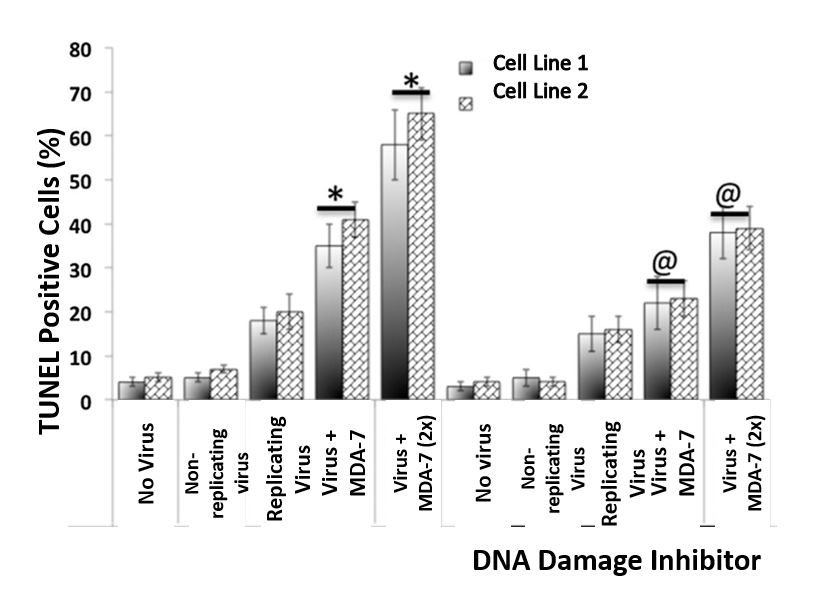
Figure 5E
|