P Bhoopathi, N Lee, A Pradhan, X Shen, S Das, D Sarkar, L Emdad, P Fisher (2016)
mda-7/IL-24 Induces Cell Death in Neuroblastoma
through a Novel Mechanism Involving AIF and ATM
Cancer Research, June 2016 76:12
mda-7/IL-24 Induces Cell Death in Neuroblastoma
through a Novel Mechanism Involving AIF and ATM
Cancer Research, June 2016 76:12
(Translated by Krishna Karamsetty)
Experiment: Experiment 2 - Cancer-terminating virus containing MDA-7 starts programmed cell death in neuroblastoma
|
This experiment was done to demonstrate that the cancer-terminating virus containing MDA-7 was successful in inducing programmed cell death in neuroblastoma cells. Each of one the procedures were done three times in different cells linesCells grown from a singular cell therefore having the same genetic structure which produced the same results. PARP Poly ADP Ribosome Polymerase is a family of proteins that are involved in a number of processes such as DNA repair and programmed cell death. When PARP Poly ADP Ribosome Polymerase is cleaved, it signals the beginning of cell death.
|
|
|
|
|
|
For Figure 2A, neuroblastoma cells in petri dishes were infected with either no viruses, the viruses that cannot replicate, the viruses that can replicate but, in all cells, regardless of cancer, and the viruses that can replicate only in cancer cells for 72 hours. After 72 hours, the lysateA collection of dead cells was collected and put through a TUNEL assay. The cells whose DNA strands were cut by the process of programmed cell death were tagged by a fluorescent dye, indicated here by a white smudge. The cells that were tagged were compared with untreated cells. In the second row, the white fluorescent tagged is noticed more, indicating that the DNA of the cancer cells were cut and tagged showing more which means that these cells were undergoing cell death as this assay was being done.
|
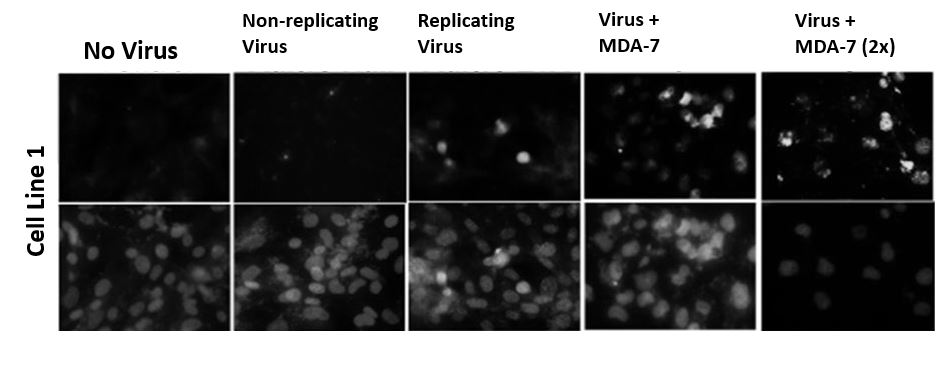
Figure 2A
|
|
|
|
|
For Figure 2B, the cells are infected the same way as 2A for 72 hours. Once the cells have been incubated, they are collected into a lysateA collection of dead cells and put through an FACS analysis. Once the flow cytometry was done, the data was presented in a bar graph with all three cell lines. When the cells weren’t exposed to any viruses, the dead cell population is relatively low however, when the cells were exposed to the virus, the dead cell population increases exponentially. The same goes cells exposed to the virus that can’t replicate at all versus the virus that can replicate in everything but not as fast as the complete cancer killing virus. This higher population of dead cells shows that when the virus enters into a cancer cell, it will kill it eventually hence the higher bars under virus + MDA-7 (2x).
|
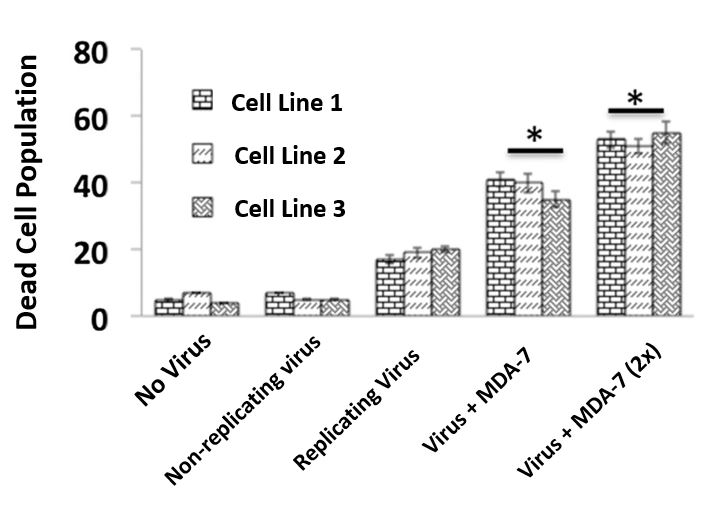
Figure 2B
|
|
|
|
|
For Figure 2C, the cells were infected the same way as 2A for 72 hours. Once the cells have gone through their 72-hour period, they are collected into a lysateA collection of dead cells and put through Western Blot for the cell death indicator using a specific antibody for that protein and beta-actin. Both rows of blots show that every cell regardless of the treatment had both the cell death indicator and beta-actin. Beta-actin however is in every cell so it is common and necessary for it to in every row however only four out of the six categories have two rows of blots instead of one for cell death indicator. When a cell undergoes cell death, the cell death indicator gets cut and when the protein is exposed to the antibody, the antibody interacts with both pieces of the protein which is why there are two lines. If the treatment has two lines, for cell death indicator, it means that the cell has either undergone cell death or was going through the process as the experiment was done. The two lines also have another important meaning. The two lines indicate that the cell was successfully infected with the virus and killed by the MDA-7 gene.
|
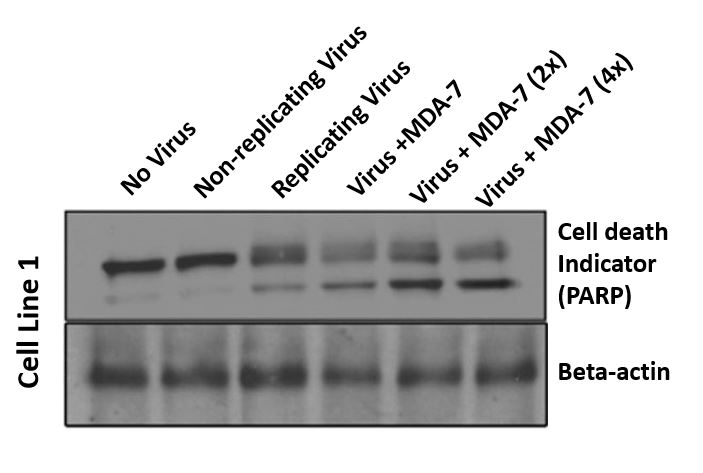
Figure 2C
|