Wuchty et al. (2017)
The Protein Interactome of Streptococcus pneumoniae and
Bacterial Meta-interactomes Improve Function Predictions.
mSystems 2:1-10
The Protein Interactome of Streptococcus pneumoniae and
Bacterial Meta-interactomes Improve Function Predictions.
mSystems 2:1-10
(Translated by Karun Rajesh)
Support: ROC Curves
|
Receiver Operating Characteristic (ROC) curves are utilized to show the connection between correctly identifying a measured outcome (true positive rate) and correctly identifying those without a measured outcome (true negative rate). The y-axis measures the true positive rate (TPR), while the x-axis measures the false positive rate (FPR), detecting an outcome significant when it is not actually.
The area under an ROC curve can be thought of as the accuracy of a test. The larger the area under the curve, the more accurate the test being measured. This accuracy is known as distinction, the ability of the test to accurately distinguish those with an outcome and those without it. The percentage reflects that if a sample was randomly selected, the chance of it being accurately put into its’ correct outcome is the given percentage.
|
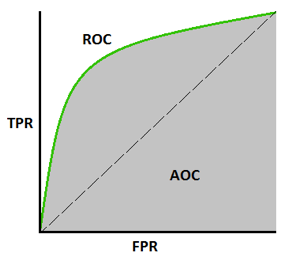
Fig. 11: Example of ROC curve. TPR stands for true positive rate (TPR), false positive rate (FPR), and area under of curve (AOC).
|
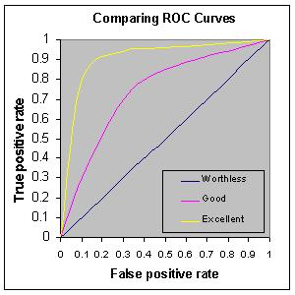
Fig. 12: Different types of ROC curves. Showing three different types of ROC curves, the excellent curve has a greater AOC with the worthless has the least AOC. The greater the AOC, the more accurate the test being graphed is.
|