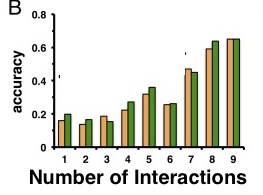
After characterizing the functionally unknown proteins of S. pneumoniae, Wuchty et al. then set out to evaluate the predictive power of these characterizations. To do this a quality control check was run to re-test the characterization of proteins. The newly characterized and previously functionally known proteins were pooled together. At random, 20% of these proteins functions were “forgotten”. In other words, the functions of these proteins were forgotten, as if the function of these proteins were completely unknown and they needed to be found out. The remaining 80% of proteins with known function were then use to find out the function of the “unknown” 20%. This was done through two methods, solely by yeast-2-hybrid method characterization and by yeast-2-hybrid supplemented with the bacterial meta-interactome interactions. This process was done 1000 times at random in order to compare the two methods and their effectiveness.
From the results, receiver operating characteristic (ROC) curves text were generated. These curves are utilized to show the connection between correctly identifying a measured outcome (true positive rate) and correctly identifying those without a measured outcome (true negative rate). The area under the curve was found to measure the prediction quality. Comparing the areas under the curve for both methods, the supplemented method was found to have a significantly higher than the sole yeast-2-hybyrid method. This suggested that the supplementation of the bacterial meta-interactome improved the quality of protein function prediction.
