Translation of Journal of Cell Science

Prosser, D. C., et al.
"FFAT Rescues VAPA-Mediated Inhibition of ER-to-Golgi
Transport and VAPB-Mediated ER Aggregation."
Journal of Cell Science, vol. 121, no. 18, 19 June 2008, pp. 3052-3061.,
doi:10.1242/jcs.028696.

(Translated by Sohail Syed)

Time Course Immunofluorescence of VSVG with relationship to the FFAT motif

Motivation

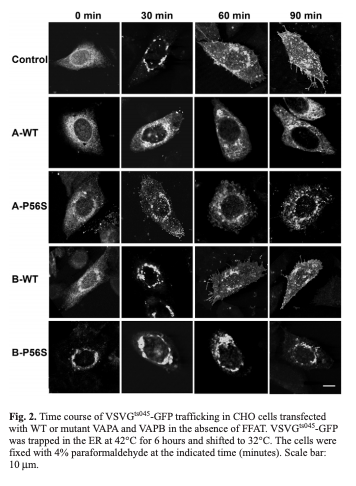
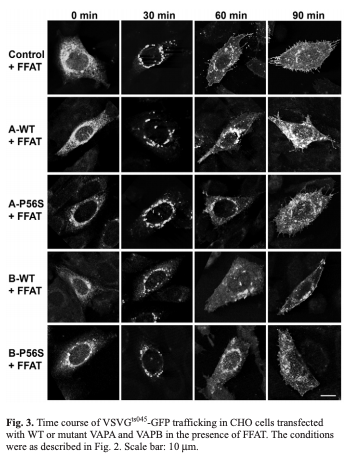
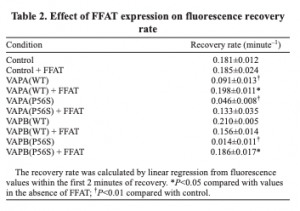
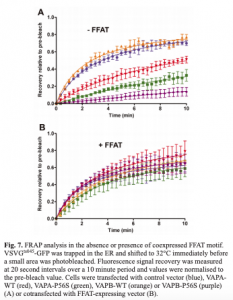
The motivation behind this experiment was to look for whether or not proteins folded correctly and whether or not those transmembrane proteins diffused from the ER to the Golgi and from there, to the membrane. The different time stamps were taken to allow experimenters to see when the transition would occur. This experiment also allows for checking to see how the FFAT motif's expression helps with diffusion.

Procedure

VSVG is used for this experiment as it is synthesized by the ER and can be tagged for Immunofluorescence. Also it is temperature sensitive meaning it can be stopped from exiting the ER at will with a temperature change.

For the experiment without the FFAT motif:

    1. Grow VAP cells at 39°C for 16 hours in paraformaldehyde

    2. Increase temperature to 42°C for 6 hours

    3. Add fluorescence flags for VSVG

    4. Add VSVG flag antibodies

    5. Drop cells to 32°C to see transport of proteins

    6. Immunofluorescence experiment

    7. Image at 0 min, 30 min, 60 min, and 90 min

For experiment with FFAT motif:

    1. Grow VAP with addition of FFAT motifcells at 39°C for 16 hours in paraformaldehyde

    2. Increase temperature to 42°C for 6 hours

    3. Add fluorescence flags for VSVG

    4. Add VSVG flag antibodies

    5. Drop cells to 32°C to see transport of proteins

    6. Immunofluorescence experiment

    7. Image at 0 min, 30 min, 60 min, and 90 min

Results

Control

  • Transport of proteins is normal

  • 30 min in ER

  • 60 min in Golgi and some in the ER

  • 90 min in Membrane

Control + FFAT

  • Transport of proteins is normal

  • 30 min in ER

  • 60 min in Golgi and some in the ER

  • 90 min in Membrane

VAPA WT

  • Blocking of transport into membranes

  • 30 min in ER

  • 60 min in Golgi and some in the ER

  • 90 min in Golgi and some in the ER

VAPA WT + FFAT

  • Transport of proteins is normal

  • 30 min in ER

  • 60 min in Golgi and some in the ER

    90 min in Membrane

VAPA P56S

  • Blocking of transport into membranes

  • 30 min in ER

  • 60 min in Golgi and some in the ER

  • 90 min in Golgi and some in the ER

VAPA P56S + FFAT

  • Transport of proteins is normal

  • 30 min in ER

  • 60 min in Golgi and some in the ER

  • 90 min in Membrane

VAPB WT

  • Transport of proteins is normal

  • 30 min in ER

  • 60 min in Golgi and some in the ER

  • 90 min in Membrane

VAPB WT + FFAT

  • Transport of proteins is normal

  • 30 min in ER

  • 60 min in Golgi and some in the ER

  • 90 min in Membrane

VAPB P56S

  • Blocking of transport into Golgi

  • ER membrane has aggregates messing up structure of membranes

  • 30 min in ER

  • 60 min stuck in ER

  • 90 min stuck in ER

VAPB P56S + FFAT

  • Transport of proteins is normal

  • 30 min in ER

  • 60 min in Golgi and some in the ER

  • 90 min in Membrane

VAPB P56S has increased immobile obstacles leading to less ER transport of transmembrane proteins meaning there are more ER aggregates

FFAT motif helps in protein folding allowing less aggregation with the ER and flow through the ER to the Golgi to the Cytosol

FRAP (Fluorescence Recovery After Photobleaching) of Immunofluorescence of VSVG Cells

Motivation

The motivation of this experiment was to check if diffusion of proteins is still working in relation to VAPs and FFAT motif and also to check to see which of the VAPs have more immobile obstacles, which are obstructions to proteins folding and moving out of the ER.

Procedure

Steps for FRAP analysis:

    1. Image cell before bleaching

    2. Hit a region of a cell with a laser bleaching the fluorescence protein

    3. Image cell every 20 sec within a 10 min period

    4. Graph recovery values

    5. Take the linear slope of the graph from 0-2 min

Results

Control

  • Recovery is a normal rate

Control + FFAT

  • Recovery is a normal rate

VAPA WT

  • Recovery is at a slower rate

VAPA WT + FFAT

  • Recovery is a normal rate

VAPA P56S

  • Recovery is at a slower rate

VAPA P56S + FFAT

  • Recovery is a normal rate

VAPB WT

  • Recovery is a normal rate

VAPB WT + FFAT

  • Recovery is a normal rate

VAPB P56S

  • Recovery is at a slower rate

VAPB P56S + FFAT

  • Recovery is a normal rate

Over-expression of VAPA and VAPB P56S leads to a slower recovery rate

  • Concentration of immobile obstacles increase

FFAT rescues recovery rate and decreases concentration of immobile obstacles