Journal of Comprehensible Results - Ria Shah

Costin BN, Dever SM, Miles MF (2013).
Ethanol Regulation of Serum Glucocorticoid
Kinase 1 Expression in DBA2/J Mouse Prefrontal Cortex
PLoS ONE 8:e72979.

(Translated by Ria Shah)

Experiment: Construction of glutamate sensors

A gene isoforms are found in the mRNA. These genes are found in similar locations but have a different starting position leading to different functions.

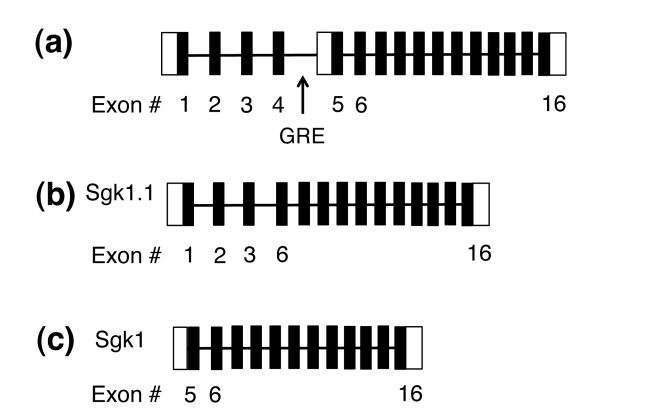
In this experiment (serum glucocorticoid kinase 1) SGK1 and SGK1.1 are both isoforms. According to (Fig. 1), part b shows that sgk1.1 is coded in the region 1-6. Part c, sgk1 is coded in the 5-6 right before the binding site of glucocorticoid response element (GRE).

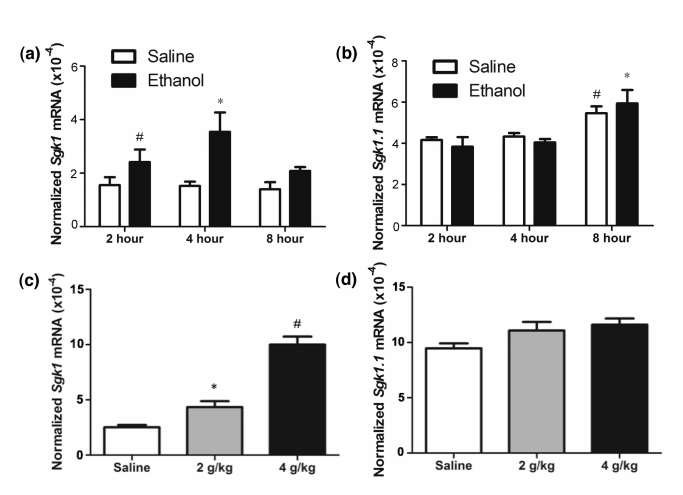
To determine the correct version of the gene a Qrt-PCR was performed to gather data on which gene had a greater affect due to the intake of Ethanol.

In order to do Qrt- PCR a DNA strand is needed. However, since the experiment has started out with RNA, reverse transcription is done through an enzyme reverse transcriptase usually found in viruses. This enzyme uses the template RNA strand to produce a single DNA strand (complementary DNA.) Then SYBR green binds to the double strands emits a low fluoresces color. The purpose of SYBR green is to indicate the termination of PCR from the level of brightness. Primers (Forward CGTCAAAGCCGAGGCTGCTCGAAGC and Reverse GGTTTGGCGTGAGGGTTGGAGGAC) for sgk1 (Forward ATGCCAACATCCTGACCAA and Reverse TGCTGGCAATCTTCTGAATAAA) for sgk1.1 are introduced. The primers are used to mark a particular position in the DNA and initiate replication ("What is Real", n.d.). At the end of DNA replication, the two strands are of DNA are binded tightly, producing a bright florescence color (Ponchel et al, 2003.) This process continues until enough DNA strands are produced. The brightness increases as the number of sets increase. Once PCR is completed the data is analyzed on a standard cure. In a quantitative measure the value around the exponential phase is taken and compared with the others. This procedure allows the comparison of gene expression at normal level vs levels with ethanol exposure.

Fig. 1: A diagram that shows the range and region of Glucocorticoid Response Element, Serum Glucocorticoid Kinase 1, and Serum Glucocorticoid Kinase 1.1 on an messangerRNA (mRNA). The dark boxes indicate the exons (regions that are coded.)

The results (Fig. 2)in graphs a and b contain data obtained from the Qrt-PCR. These graphs show how the expression of gene varies depending on the type of solution introduced (i.e. ethanol and saline) over 8-hour time period. SGK1 clearly shows a difference in expression when exposed to ethanol vs saline. On the other hand, sgk1.1 doesn’t show much change. In graphs c and d, measured gene expression depending on the amount of ethanol consumption (2 g/kg and 4 g/kg) and saline. Again it showed how sgk1 showed a major difference between saline concentration and ethanol concentration. Whereas, sgk1.1 didn’t show as much change between the two ethanol concentrations. A smaller difference was seen between the saline and ethanol compared to SGk1.

Overall, sgk1 was effected from ethanol due to abnormal increase gene expression. Thus, this gene was selected for further analysis.

Fig. 2: The graphs compares how genes Sgk1 and Sgk1.1 respond to different factors (x-axis). The y-axis (part a-d) measures the amount gene expression obtained from Qrt-PCR.