In Figure 3, the x-axis shows the varying GlcN-6-P concentration in mM, and the y-axis shows the activity of NagB in U/mg (units per mg). The top two slopes pertain to a pH of 6.5, and the bottom two slopes pertain to a pH of 8. The kinetics were measured using 0.2 mM GlcNAc-6-P in the presence (+HPr) and absence (-HPr) of 2 uM HPr at pH 8, and without GlcNAc-6-P at pH 6.5 The slope with +HPr at pH 8 with .2 mM GlcNAc-6-P shows the quickest activity at a low GlcN-6-P concentration, hitting a Vmax of about 15 U/mg, while the slope with -HPr at pH 8 with .2 mM GlcNAc-P shows activity at a higher level of GlcN-6-P, hitting a Vmax of about 10 U/mg. The Khalf of +HPr is around 4.4 and 9.1 for -HPr. The slope with +HPr at pH 6.5 with no GlcNAc-6-P shows activity at a lower amount of GlcN-6-P, hitting a Vmax of around 35 U/mg; the slope with -HPr at pH 6.5 with no GlcNAc-6-P shows activity at a higher amount of GlcN-6-P, hitting a Vmax of around 24 U/mg, which is seen in the graph.
Rodionova IA, Zhang Z, Mehla J, Goodacre N, Babu M, Emili A, Uetz P, Saier MH Jr. (2017)
The phosphocarrier protein HPr of the bacterial phosphotransferase system globally
regulates energy metabolism by directly interacting with multiple enzymes in Escherichia coli
J Biol Chem. 2017 Aug 25;292(34):14250-14257
The phosphocarrier protein HPr of the bacterial phosphotransferase system globally
regulates energy metabolism by directly interacting with multiple enzymes in Escherichia coli
J Biol Chem. 2017 Aug 25;292(34):14250-14257
(Translated by Shravani Wadwekar)
Experiment 3: Allosteric activation of NagB by HPr and GlcNAc-6-P
|
HPr and NagB activity was measured by performing HPr-dependent allosteric regulation (when a ligand - a molcule or ion - binds to a site, other than the active site, to regulate activity) through a coupled assay involving the conversion of GlcN-6-P to Fructose-6-P by NagB, followed by isomerization (same molecule with same number of atoms, different arrangement) to Glucose-6-P by Pgi and oxidization of Glucose-6-P to Gluconate-6-P by Zwf. 2 uM of HPr or HPr-P were added to an assay mixture.In this experiment, HPr had an effect. HPr was then incubated (set in a favorable environment that stimulates growth or development) for 40 minutes at 30 degrees Celsius. In a separate reaction mixture, 20 ng of NagB was added to 100 uL of a reaction mixture containing several concentrations of substances including 0-15 mM of GlcN-6-P, 2mM NADP, 1.2 units of Pgi, and 1.2 units of Zwf. 2 uM of HPr from the first assay mixture were then added to the NagB reaction mixture. The GlcN-6-P was converted to Fructose-6-P by NagB, and isomerized to Glu-6-P by Pgi. During the second reaction, Glu-6-P was then oxidized to GlcN-6-P by Zwf, dependent on the reduction of NADP to NADPH. The NADP to NADPH reduction concentration in the presence and absence of HPr was measured to give a graph of steady-state kinetics (when all state variables are constant; everything but the varying concentrations of Glc-N-6P). Steady state kinetics include the Khalf, Vmax, and the Hill Coefficient, shown in Table 3.
|
|
|
|
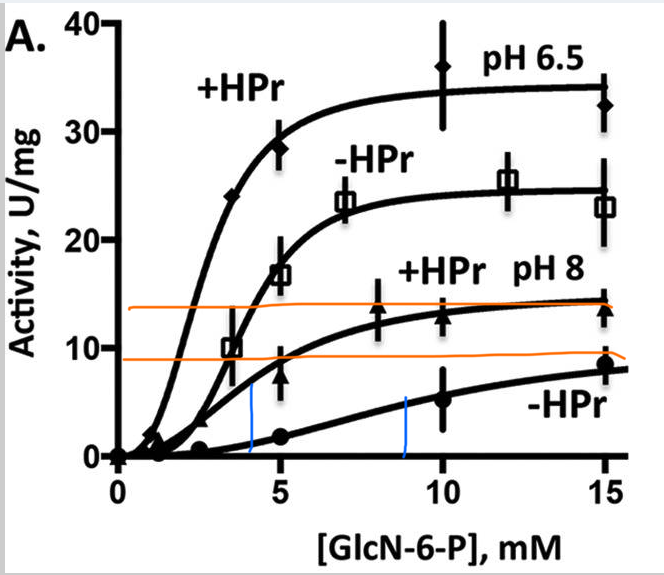
Graph 3. Allosteric activation of NagB by HPr. Graph shows NagB activity dependent on varying GlcN-6-P concentration and absence or presence of HPr. The top 2 slopes are at a pH of 6.5 and the bottom two slopes are at a pH of 8. The presence of HPr is identified by +HPr and the absence of HPr is identified by -HPr. The graph exhibits the Vmax, which is shown by orange lines, and the Khalf, which is shown by blue lines.
Adapted from "The phosphocarrier protein HPr of the bacterial phosphotransferase system globally regulates energy metabolism by directly interacting with multiple enzymes in Escherichia coli." by Rodionova IA, Zhang Z, Mehla J, Goodacre N, Babu M, Emili A, Uetz P, Saier MH Jr., 2017, J Biol Chem, Page 14253. |
|
|
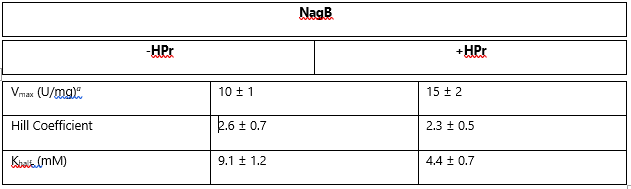
Table 3. Steady State Kinetics of NagB in the absence (-HPr) and presence (+HPr) of HPr at a pH of 8. Table shows the Vmax, Hill Coefficient, and Khalf of the activity. They are visually represented in Graph 3.
Adapted from "The phosphocarrier protein HPr of the bacterial phosphotransferase system globally regulates energy metabolism by directly interacting with multiple enzymes in Escherichia coli." by Rodionova IA, Zhang Z, Mehla J, Goodacre N, Babu M, Emili A, Uetz P, Saier MH Jr., 2017, J Biol Chem, Page 14252. |
|
|
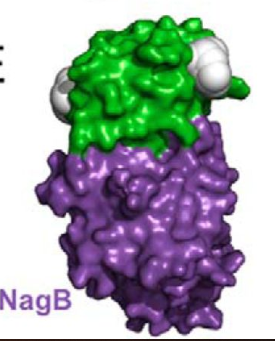
Figure 3. Complex of HPr and NagB. Figure shows the complex of HPr and NagB. HPr is represented by green and NagB is represented by purple.
Adapted from "The phosphocarrier protein HPr of the bacterial phosphotransferase system globally regulates energy metabolism by directly interacting with multiple enzymes in Escherichia coli." by Rodionova IA, Zhang Z, Mehla J, Goodacre N, Babu M, Emili A, Uetz P, Saier MH Jr., 2017, J Biol Chem, Page 14254. |
|
|