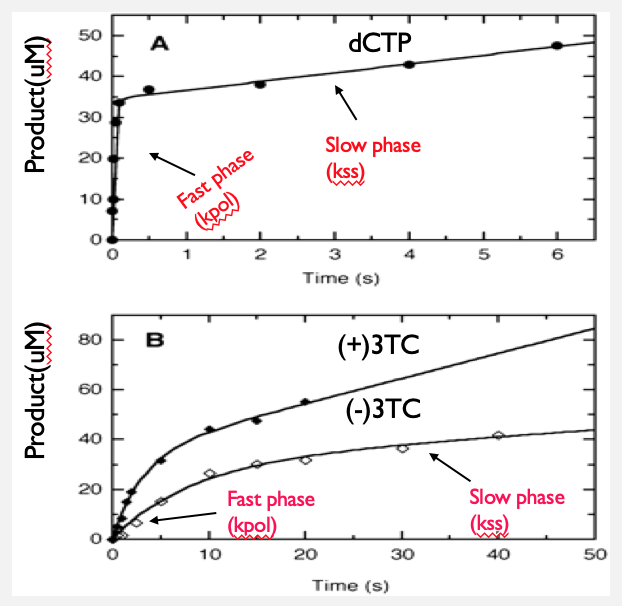
Image A and Image B are graphs which represent the burst experiment. The idea of the experiment is to see the rate of DNA polymerization that is occurring when DNA polymerase is given its DNA and nucleotide substrates. The dots that are represented in each of the graphs show the amount of product formed when DNA is extended by 1 nucleotide by the DNA polymerase. In the case of Image, A, the wild-type dCTP was added to the DNA polymerase/DNA duplex mixture. The reaction is stopped at the timepoints indicated in the graph, and the amount of 24mer is measured by densitometry. The solid line represents the best fit (burst equation) of the data into two phases. The first phase is known as the fast phase and the second phase the slow phase. The fast phase represents the burst or the actual rate of incorporation by mitochondrial DNA. The slow phase represents the 'steady state' or time it takes for the mitochondrial DNA polymerase to let of its DNA product and bind a new substrate. Feng et al (2001) created a synthetic DNA duplex containing a 23 and a 45-nucleotide sequences (Fig). Once the product is formed the 23-nucleotide sequence will become a 24-nucleotide sequence (Fig).
Image A shows the incorporation of the natural occurring nucleotide and was used to determine the rate which a new product is formed. Image A can be compared with Image B where the graph illustrates two lines representing incorporation of the nucleoside analogs into DNA. One line indicated the (+)3TC identified by a solid diamond shape and (-)3TC plotted by the open diamond shape.
Image B are enantiomers (+) and (-)3TC which is being compared back to the wild type, dCTP. The incorporation of a nucleotide in Image A is seen to be almost instantaneous. The first test of incorporation is seen to happen in less than a second. Image B now are the analogs which are exhibiting toxicity. Both are seen to have a slow incorporation rate. (-)3TC (open diamonds) is a better inhibitor than (+)3TC (closed diamonds) because the rate of polymerization is slower, suggesting it is an ideal substrate for mitochondrial DNA.