Antibody array is a technique commonly utilized to observe cytokine within cells. These molecules may include a variety of substances, including growth factors. The procedure begins with staining antibodies, and then the antigen (the factors) bind to the and then the interaction is detected between the two. The antibodies can be placed on a variety of surfaces, usually a silicon chip or a glass slide. This technique presents an image that is similar to gel electrophoresis but at the same time allows for the observation of many more subjects. For example, the examination of 53 angiogenesis proteins was done in this experiment alone. Significant factors that were examined included PDGF -AA, PDGF -BB, PIGF -2, MCP-1, MMP-3, and IGFBP-3.
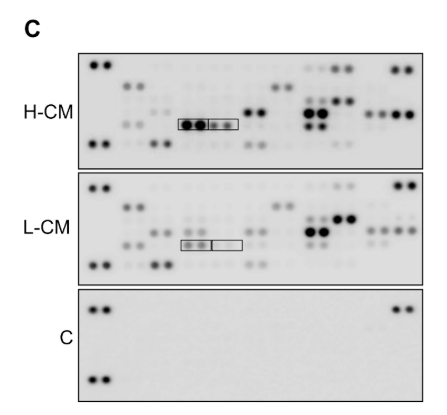
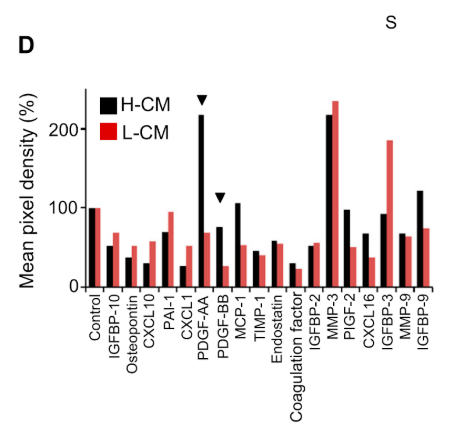
It can be seen that the marks within Fig. 3C are more prevalent within H-CM as compared to L-CM, meaning that several factors including PDGF -AA, PDGF -BB, MCP, PIGF. This can also be seen within Fig. 3D. They found that although PDGF -AA exhibited a higher density as compared to PDGF -BB, even though PDGF -AA exhibited fewer effects on senescence.
Antibody Array; The Procedure
1. To start off, samples are mixed with a mixture of biotinylated antibodies. Biotinylation is the process of utilizing biotin to attach it to each one of the proteins studied. This is done on a membrane, not a cellular membrane, but rather a thin sheet that is provided within the Assay kit.
2. Samples then undergo incubation. What these first two steps do in conjunction is attach the antibodies to angiogenesis related proteins.
3. Reagents are then utilized to visualize proteins via luminescent reagents.
4. Analytes, which are the substances being measured, can include a variety of things. In this case, they visualized 53 angiogenesis proteins as well as 40 cytokines, including PDGF-BB and FGF-2. All of these proteins and proteins are separated on a grid, and their expression is represented by the luminescence.
5. Levels of light intensity are then measured by usually a machine that contains a camera. Another machine is then utilized to measure the assay in terms of pixel density.
6. All of this occurs on the proteins extracted from the ESCs. The main purpose to this was to examine a greater number of analytes as compared to western blot which could become extremely time consuming especially with a limited sample.
7. I have included a figure within the support page labeled antibody array for further elaboration provided by RD Systems.