Siemens MPI Processing Protocol
- After selecting the patient and appropriate acquisitions the data above appears
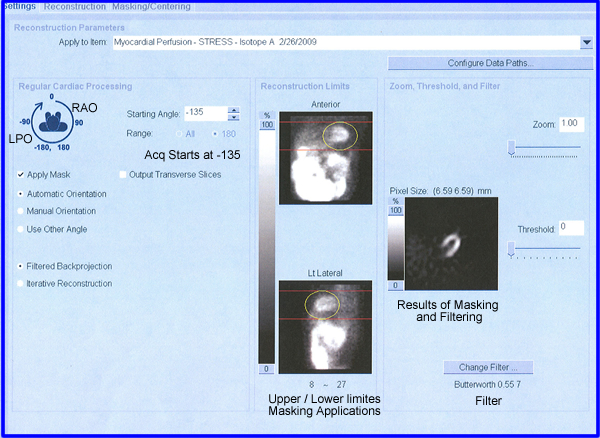
- Settings
- Patient orientation is noted with the starting angle of -135o with 180o rotation
- Mask is applied which is the circle around the LV
- Filtered Back Projection (FBP) is selected for processing
- Reconstruction limits are set - correlate this to Philip's system
- Movement of the upper and lower red lines are adjusted to determine which area is going to be processed
- This tells the computer to process all the data between the two red lines and within the ellipse
- The yellow ellipse is displayed around the LV. This mask will cut out any outlining activity, such as unwanted GI
- The initial processed data is displayed allowing the technologist to
- Adjust/change the filter (current setting is Butterworth 0.557)
- Adjust the zoom and threshold data by moving the scale
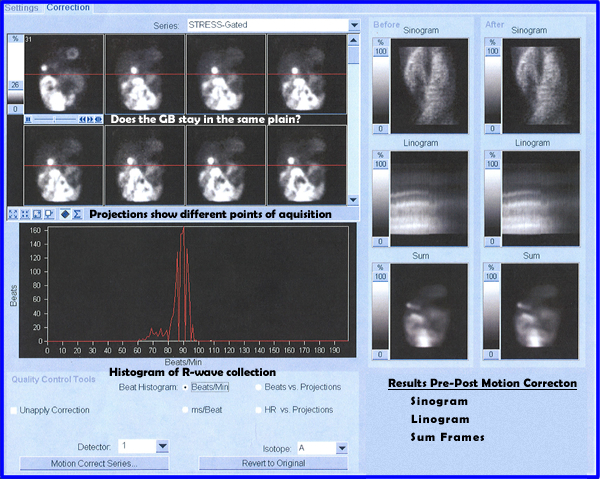
- Autocardiac program applied to the mask and filtered data display the cardiac cine
- Initial evaluate is to assess the raw data (cine) to determine
- Is there any attenuation artifacts that might adverse effect myocardial wall uptake?
- Is there patient motion? -
Consider:
- Lining up the gal bladder, does it appear to bounce? Or stay in the same plane
- Linograms and sinograms display will also show patient movement by noting a disruption with the line. According the data display is there any patient movement?
- Summation image sums all the images collected during SPECT and displays it as one frame
- In the above images motion correction was applied and the pre-post results are displayed in the linogram/sinogram
- Histogram shows where the R waves were collected
- The role of the histogram to determine is there are too many irregular cardiac contractions
- A window should be set so that the extreme range of irregular beats are not acquired, but rejected
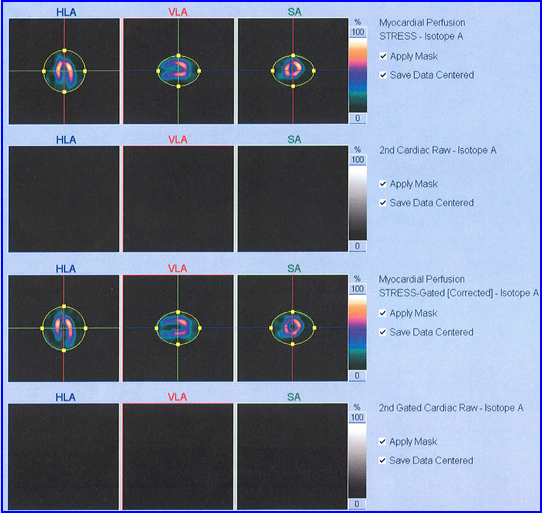
- Images can then be adjusted in their three different projections: horizontal long, vertical long, and short axis
- Make sure that the LV is centering
- Confirm that GI activity has been eliminated
- Centering and masking can be re-adjusted at this point
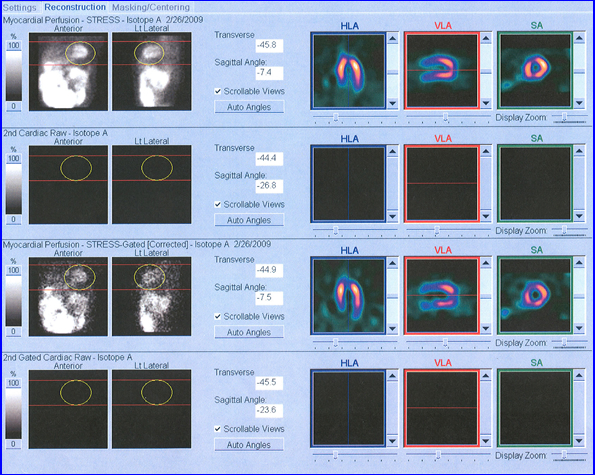
- Final step before displaying the processed images
- Just like before the red lines process all the data within their regions
- The mask is re-applied
- Results are show to the right
- Above images are only showing the processed stress data
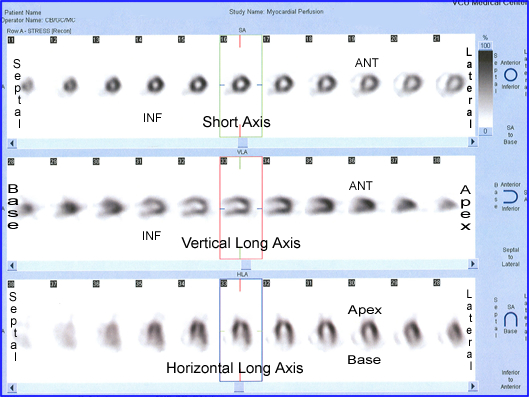
- Display the FBP data
- Vertical Long, Horizontal Long, and Short Axis
- Only the stress data is displayed, while normally both sets (stress and rest) are available for review
- This processed data is then sent for further quantifications via Cedars or Emory Toolbox software
Return to the Previous Lecture
Return to the Table of Content
3/22