- n addition:
- Spleen and bone marrow function is assessed
- These organs contain Reticular Endothelial Cells (REC) which is part of the Reticular Endothelial System (RES)
- Radiopharmaceutical
- 99mTcSulfur Colloid
- Particle size = 0.1 to 1.0 micron
- Compare a capillary to sulfur colloid (diameter): 7 to 8 microns
- Physiology
- All cells in the RES engulf the passing particles by a process known as phagocytosis
- There two different patterns of disease
- At the cellular level
- Kupffer cells show reduced uptake and/or liver enlargement
- As the disease progresses colloidal shift occurs where 99mTcSC uptake shifts from the liver to the spleen and bone marrow. This may be seen as:
- Reduction in liver uptake
- Splenomegaly
- Activity seen in the bone marrow (sternum, ribs, pelvis)
- There is variation pending the severity of disease
- Space occupying lesion(s)
- There are no viable Kupffer cells within the lesion
- Lesion lacks uptake translating into a cold area (there are a few exceptions)
- In a healthy liver
- The liver and spleen filter colloid particles
- Greater than 80 percent of the colloid perfuses into viable Kupffer cells
- The remainder will distribute to the spleen with a smaller percentage going to the bone marrow
- Complete phagocytosis normally occurs in about 5 minutes if there is normal liver function
- Liver disease
- Hepatocellular disease, which involves the entire liver and is seen at the cellular level:
- Hepatomegaly
- Colloidal shift
- Splenomegaly
- Uptake in the bone marrow
- The two main categories of disease would be: cirrhosis and hepatitis
- Space occupying lesion may be due to
- Tumor or fatty deposits in the liver
- Metastatic disease, which usually has multiple lesions
- Appears as a cold spot(s)
- Colloidal shift may occur when the disease is extensive, such as numerous metastatic lesions
- Exams of this disease state include but not limited to: primary liver cancer, metastatic disease, and fatty tumor
- Imaging
- Flow study may or may not be performed
- Patient dose ~ 5 mCi
- Following the injection wait 15 minutes before the image. This allows enough time for 99mTcSC to be picked up by the RES
- Planar imaging
- Matrix size = 256 by 256
- Collimator = LEHR
- 500 to 1000k counts per image
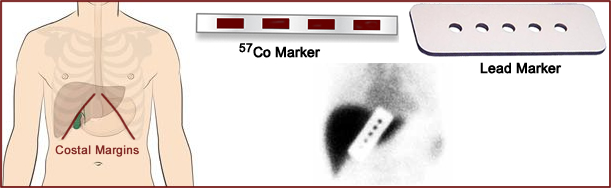
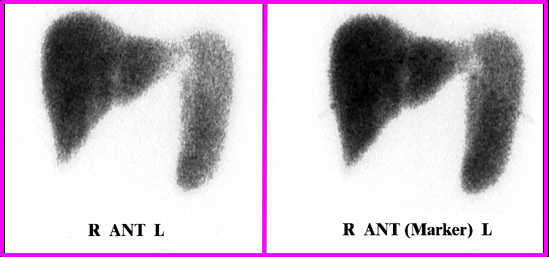
- ANT image should include a lead ruler or 57Co marker
- Marker is placed on the right coastal margin to note the orientation of the liver and spleen
- Lead and Cobalt marker is comprised of 2 cm sections that are used to measure the liver and spleen
- After the marker image is taken a second ANT is completed without the marker
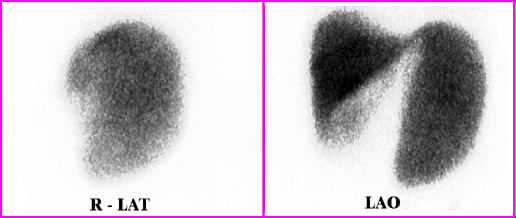
- Then the following images are taken: LAO, RAO, R-LAT, L-LAT, LPO RPO, and POST
- SPECT imaging is suggested. This is due to the amount of tissue density in the right lobe of the liver
- Matrix = 64 by 64
- 64 Stops
- 20 to 30 seconds per stop
- 360-degree rotation
Now let us look at several case studies
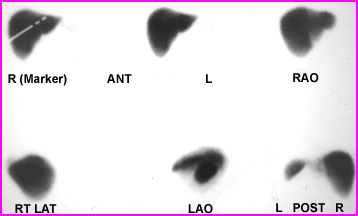
The first case study is an example of a normal liver/spleen scan. Six views are taken and normal radiopharmaceutical distribution is seen. Comments: Spleen and liver are of normal size; normal radiopharmaceutical distribution; and no bone marrow uptake.
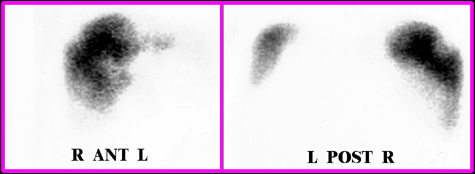
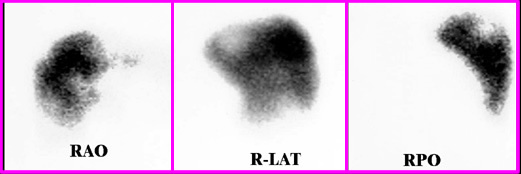
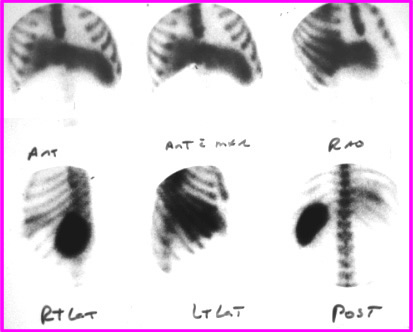
The next case is an example of space-occupying lesions. The main lesion is located in the upper right lobe of the liver and can be identified in every view that is taken. These photopenic areas lack activity because there are no Kupffer cells within the lesion. Liver cells have been destroyed by metastatic cancer
The third case study is an example of hepatomegaly and splenomegaly. This patient has an early stage of hepatocellular disease. The result is an increased size of the liver and spleen. Do you see a 57Co marker?
The last case study is a classic example of a patient with advanced cirrhosis of the liver. Characteristics of this disease is the loss of liver function resulting in colloidal shift of the radiotracer to the spleen and bone marrow. Furthermore, note how much hotter and larger the spleen. This is best seen in the posterior or left lateral views
The Liver/Spleen Scan procedure
Return to the beginning of the document
Return to the Table of Contents
Continue to Hepatobiliary Lecture