- Multigated acquisition - May be referred to as a MUGA or CINE
- SPECT perfusion can also be gated which is done usually on stress images. The format is similar in concept to a MUGA and will be discussed briefly
- In vivo labeling - covered in the Spring
- In vitro labeling
- 2 - 3 ml of blood is removed from the patient and labeled in vitro
- The kit required for this is called "Ultra Tag"
- Refer to package insert for labeling (to be discussed in detail next semester)
- Once the blood is labeled, re-inject IV and image
- Modified In Vitro will be discussed in 2007
- The key ingredients to labeling
- The stannous ion adheres to the red blood cells (RBCs)
- After allowing the stannous ion sufficient time to tag, 99mTcO4- is injected
- Hence the 99mTcO4- tags to the Sn- that tags to the RBC
- Once the blood is labeled the acquisition may begin
- First look at the figure above, which is an example of an electrocardiogram (EKG)
- The following parts of the EKG wave or electrical activity of the myocardium are identified:
- Three leads are attached to the patient in order to pick up the R to R interval which is needed for a MUGA acquisition
- How is the heart gated?
- The EKG signal is gated, from each R to R interval
- From the above diagram notice how the R to R interval is subdivided into 5 sections
- Each section, frame, or gate is considered as a segment of time in which counts are collected and stored
- Each time the computer records an R wave acquisition is reset to the first frame and more counts are stored within each individual frame
- Acquisition continues until enough counts are collected in each frame
- Images above the EKG wave represent the data collected in each frame
- In a resting image usually 400 beats or R waves collected is considered sufficient
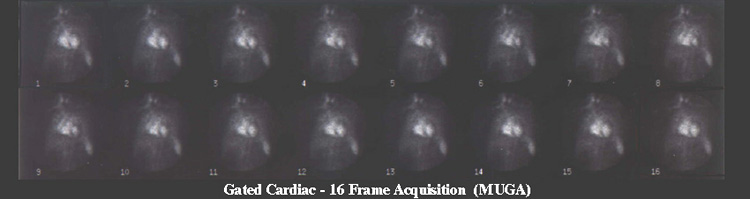
- Images can then be played back in a dynamic or cine mode that identifies myocardial wall motility (see image below - "Displaying the MUGA")
- Wall motion
- Images show wall motion of the heart, however, you are actually seeing labeled RBCs moving in and out of the heart chambers
- There are four types of wall motion to consider:
- Angles that are imaged
- ANT
- RAO at 10 to 15 degrees
- LAO 30 - 45% (look for angle that best separates the LV)
- Steep LAO or LEFT LAT
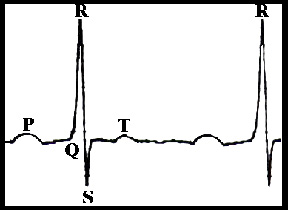
P - signal for sinus node impulse to depolarize the atria
QRS complex - electrical depolarization and contraction of the ventricles
P - recovery phase of the ventricles
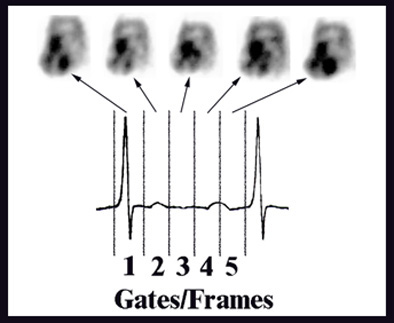
Note: For demonstration purpose only, 5 gates were used in the above diagram. Usually, the amount of gates set from the R to R interval is as few as 16 or as many 32.
Normal contractility of all walls
Hypokinesis - one wall or section is moving slower than the rest
Akinesis - one wall or section is not moving at all when compared to the rest
Dyskinesis - one wall or section is moving in opposite direction to the other
- All angles are played back as in a dynamic format
- Images can also be displayed in static mode (see the above)
- Wall motion is defined as: normal, hypo kinetic, akinetic, or dyskinetic
- Images can be filtered to improve image quality (discussed next semester)
- Key - To quantify or calculate left ventricle ejection fraction (EF)
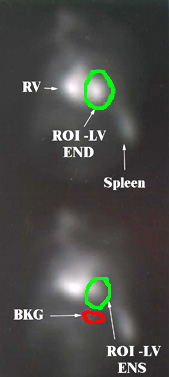
- From the images being displayed above, a region of interest is drawn around the LV
- The very first frame represents the end-diastolic (END) image
- Depending on how automated the computer software is, you may or may not be required to draw the initial ROI around the LV
- Computer will then calculate the activity in each frame, inside the ROI of the LV
- Counts are stored
- Computer will allow the user to verify the end-systolic (ENS) image, the ROI with the least amount of counts within the LV
- Computer will allow the user to confirm the ROI drawn for bkg
- Computer will then subtract bkg counts from each frame to calculate EF and display the EF curve
- If necessary, any or all ROI(s) can be redrawn should the observer disagree with the automated ROI locations
- The above image shows the LV on END and ENS, plus the area where the bkg ROI is located
- Computer then calculates the %EF using the above formula
- Computer will also display an ejection fraction curve (image not available)
![]()
- Usually a MUGA study only involves resting images with the following angle images: ANT, RAO at 10 to 15 degrees, LAO 30 - 45%, and Steep LAO or LEFT LAT
- Stress gated cardiac procedure will be covered next semester
- Computer gates each step or projection of the SPECT study
- Usually 8 frames are gated within each projection
- Wall motion can be determined via wall thickening
- %EF can be determined via this acquisition
- Images are not available