Gating the Blood Pool Images
- To review additional information that was covered last summer click here
- Calculating the msec/frame rate
- Consider this: a patient has a heart rate of 72 beats per minute. What is the msec/frame rate between the R to R interval if the computer collects 24 frames per R to R?
- (60 beats/minute)/ 72 beats/minute = 830 msec
- 830 msec/24 frames = 35 msec/frame
- What is the difference between first pass and a MUGA?
| |
MUGA |
First Pass |
|
Acquisition time |
- 2.5 to 3 minutes for a stress
- Up to 10 minutes for rest
|
30 to 60 seconds for stress and rest |
|
Imaging the LV and RV and calculating the EF |
- Overlap or interference of the ventricles
- SPECT helps but cardiac motion makes processing difficult
|
Process first pass data from ANT allows analysis of both RV and LV separately |
|
Count density |
Greatly improved |
Sensitivity, not resolution |
|
Time |
Can image over several hours if necessary |
Limited to first pass data |
|
Views |
Various views allow visual analysis of the entire heart |
Limited to first pass data |
- Different views in a MUGA?
- ANT - RA size/motion, tricuspid valve motion, RV/pulmonary artery size/motion
- 45-LAO - separate RV from LV to calculate EF of the LV, RV ANT wall/time/motion, LV POST wall/time/motion, septum motion/thickening
- LLAT - LV inferior/posterior wall time and motion, LA size/motion
- Labeling the RBCs
- In vivo - 60 to 90% tagged, with literature indicating a 69% tag
- Modified in vitro - 95% tagged
- In vitro - 99% tagged
- Labeling procedure - see protocol
- Using 99mTc albumin (Tc99mHSA)
- May be used in place of the labeled RBCs
- Diffuses out of the vascular pool along with the plasma which increases background and liver uptake
- Comments on gating
- EKG and gating (assume there are 16 gates or frames)
- Forward gating technique (standard technique) looks at the R to R interval, divides it into 16 frames and starts collecting the information, starting at the first frame
- If an R to R interval is too long, then the last frame will not correspond to the end of the cardiac cycle
- If the R to R interval is too short, then the last frame of the cardiac cycle ends before the 16th frame (images "wink out" at the end of the cardiac cycle when displayed).
- Reverse gate
- Looks at the last frame of the R to R interval and sets the gating from this standpoint
- Problems can occur at the beginning of the cardiac cycle instead of the end
- Combining the forward and reverse gate improves the accuracy of gating
- Setting a R to R window allows the computer to reject beats that are significantly too long or short.
- Similar to setting a percent window on a gamma camera which accepts or rejects an incoming gamma
- Percent window is set to a time instead of energy
- A beat that falls below or above the acceptable limits is rejected
- List Mode
- All the beats are collected and stored in the computer
- Processing the data allows the user to accept or reject specific beats
- Beats that are accepted are summed into the R to R interval
- Disadvantage - requires a lot of memory storage
- Stress test
- Tl-201 or Tc99m myocardial perfusion agents have for the most part replaced stress testing. However, if a MUGA stress test is performed, the following points must be made
- A 12-lead EKG must be used in order to monitor the heart
- Ergometer (bike) is used instead of a treadmill
- Patient must placed on a bed that can be elevated
- Patients feet must be strapped into the pedals
- Resting image is first collected for up to 10 minutes (go for high count density)
- When stressing the patient a specific amount of resistance is applied to the pedals for each level of stress, for approximately 3 minutes per stress level
- Stress images are collected for 2.5 to 3 minutes per level of stress
- Goal - to achieve 85% of the maximum heart rate
- Following the stress procedure, a post-stress image should be acquired
- Comment on results
- Each level of stress should indicate at least a 5% increase in the injection fraction
- Walls that are hypokinetic indicate ischemia
- Walls that are akinetic usually indicate infarct
- Walls that are dyskinetic usually indicate infarct/aneurysm
- Rest test - see procedure which contains stress and rest protocol
- Comments on image filtering
- Filter is used to remove noise from the image
- Selecting the right filter removes noise from the image
- Example of a filter
- We've discussed the use of a 9-point smooth in a planar image
- Image wrap (temporal filter)
- There are a total of 16 frames
- Computer takes images 1, 2, and 3
- Finds the average
- Creates a new first frame
- Computer goes to frame 2 and averages 2, 3, and 4
- Generates frame 2
- This cycle continues through all 16 frames
- The temporal filter is used to limit selected frequencies in the image, which are defined as noise (background)
- Comments on quantification
- Phase and Amplitude Images
- Phase images represent a graphical analysis of the events that occur in a cardiac cycle
- The change in counts in each pixel is analyzed in a frequency domain, using a single harmonic Fourier filter, where a cosine curve is fitted to the data
- The cosine curve of each pixel is characterized by its amplitude and its relationship to the cardiac cycle
- First frame is designated with a phase angle of 0 degrees
- 180 degrees becomes ENS, which is 180 degrees out of phase with the first image
- 360 degrees becomes END or returns to the 0 degrees
- Color is assigned to each phase angle which is then displayed graphically
- Results
- In normal wall motion, when ventricles contract at the same time, uniform color is displayed [blue-dark blue]. By contrast, during the same time frame, the atrial pixels are 180 degrees out of phase, because they do not contract at the same time as the ventricles (note uniformity and difference in color in the atrial pixels [yellow-orange]
- Abnormal wall motion shows pixels that do not change in unison; therefore, different sets of color can be seen in the ventricles and atrial pixels
- Amplitude image is the relationship between height of the fitted cosine curve, and represents the maximum change in counts between the peak and nadir (bottom) of the cosine curve
- The greater the change in counts within each pixel, the greater the change is within the cosine curve
- Change relates to the count variation and is graphically displayed on color scale
- The greater the change, the brighter the color
- Results
- Darker images indicate lack of or decreased wall motion
- Brighter images indicate motion which is due to pixel variation
- Similar to a stroke volume image
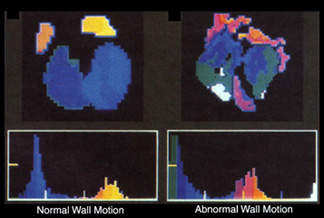
Phase Images - From the images above, note that the normal image shows uniform blue color is noted in the ventricles and lighter colors seen in the atriums (180 degrees). The graph below the normal images show 0 degrees = dark colors and 180 degrees = bright colors. In the abnormal image, note how there are changes in color within the ventricles and atriums which indicate abnormal contraction, while the graph also indicates multiple color changes within the same region of the graph.
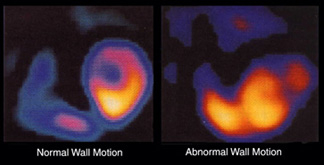
Amplitude Images - In the normal image, note how the bright yellow color within the LV indicates movement from END to ENS. This movement relates to maximum color/activity change within each pixel. In the abnormal image, color changes within the pixels show nothing that looks like a LV, indicating abnormal movement.
Return to the beginning of the document
Return to the Table of Contents