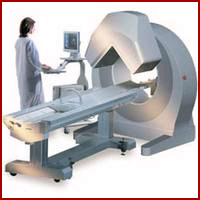
- Gated SPECT
- Like a MUGA, SPECT myocardial imaging can be gated. Why would you want to this?
- Identifies wall motion that in turn defines cardiac contraction in the form of wall motion thickening
- The loss or reduction of wall thickening indicates disease
- Ejection fraction of the LV can be calculated, which further helps in diagnosing ischemia/infarct
- A look at the type of radiopharmaceuticals used in gated SPECT
- Generally, 99mTc-cardiac tracers are preferred over 201Tl
- It is my opinion that gating thallium really shouldn't be done. Why? It boils down to poor counting statistics. Consider the need for counts and the concept of count density when taking a single static image with thallium image. Now employ SPECT, where you acquire 32 separate images each collected over a short period of time in a 180 degree arc. Finally, for each separate image within the SPECT scan has to be divide into 8 images to create your cine
- Depuey EG, et al. calculated the count densities of 201Tl and MIBI SPECT images and determined MIBI to be 3.47 times greater. Additionally, between the gated procedures, there was some inter-observer disagreement when it came to thallium studies. Ironically, in the end, Depuey stated that gated 201Tl was still a reliable procedure given some limitations
- Kapur, A et al. stated that there is no difference in sensitivity or specificity, when comparing thallium and 99mTc, however, he noted two concerns: attenuation and low count density artifacts when using thallium
- So while there is an apparent issues with gated 201Tl SPECT, it can be done as long as you know its limitations. The preferred agent for gated SPECT gated has to be 99mTc
- Just a thought - You can bill more $ when you gate the myocardium
- EKG has to connected to the acquisition computer in order to gate the R to R interval
- Each slice is gated for 8 frames, however, 16 frames may also be done. These frames are also known as bins
- Gating defines temporal resolution. The more bins you have the greater the temporal resolution
- However, the greater the amount of bins translates to a decrease in spatial resolution
- What method(s) are used to gate the heart?
- Fixed acquisition mode occurs when the computer evaluates the prior R to R waves before the acquisition starts (usually 10 to 20 Rs). Once determined, the computer uses a "fixed" time to collect the R to R data
- Variable acquisition mode occurs when the computer continually monitors the R wave and changes the rate as the heart rates varies
- List mode is the final method to consider. This is where the computer collects all R to R over a period of time. Then after the data collection the user decides which R wave interval to use
- Setting the Beat rejection window
- This concept allows the user to set a percent tolerance around the mean R to R interval so that if a cardiac contraction is significantly out of phase with the normal heart rhythm, then it is rejected. Usually the window is set between 20 to 50%. The result is anything outside that range gets rejected
- Ironically, I have seen some departments set this window to 100%. The problem with this concept is simple, no matter what the cardiac contraction is it will be accepted. In patients that have very irregular heart rates temporal blurring will occur
- What is temporal blurring? This is where the R to R interval varies with the mean heart and part of the counts from the incorrect contraction bleeds into the adjacent bin
- There are two ways in which to confirm if temporal blurring has occurred
- When the cine is played back one or more of the frames will show "flashes" of pixels when the cine is played back. The apparent cause of this has to do with the last frame (or frames) having reduced counts based on the changes in heart rate. The computer then attempts to normalize these images and the pixels within the frame that have very low count are multiplied by a high value resulting in flashing pixels
- Look at the histogram of R waves and see if there is more than 1 peak. In the above example there are two significant peaks A and B. This shows that there is too much influence of a second R to R intervals (peak B) in this gated acquisition. As a result temporal blurring will occur because of the influence of peak B. As for C and D peaks, their contribution is insignificant because there is only a small amount of irregular Rs
- Processing data that has temporal blurring
- Blurring can usually be removed by dropping the last image in the cine. This may not solve the blurring issue, but it should remove the flashing seen in the raw data
- Failure to remove the flashes will cause streaking in the processed data
- Time per frame is department dependent. Also consider
- The type of radiopharmaceutical injected
- The amount of radiopharmaceutical injected
- The amount of detector head used in acquisition
- 180 degree acquisition is the usual amount of data data collected
- Preferred detector design would include
- Two detectors
- L-shaped where the two camera heads are perpendicular to each other, each covering 90 degrees of acquisition
- A single head will also accomplish this procedure, however, it will take longer to acquire the data
- Processing the data of a gated SPECT
- points to consider
- Processing is similar to SPECT cardiac
- Computer application will take longer because of the increased data that needs to process. Instead of 1 image per slice the computer is reconstructing 8 images per slice
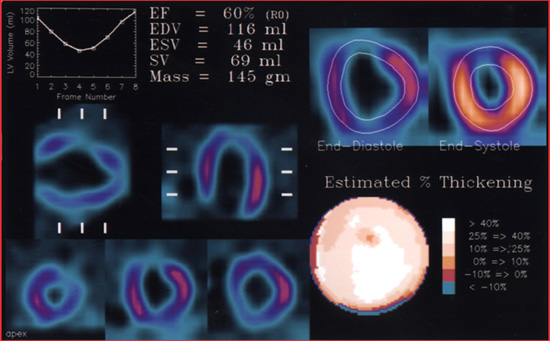
- Data is displayed below
- Note the ENS and END images are displayed with the edges being outlined by the computer
- EF curve is also being displayed
- Bullseye type map shows the amount of contractility or estimates the amount of wall thickening
- Computer calculates the amount of blood/volume within the LV during END and ENS
- Data rendering from gated wall motion
- Quantifying the EF of the LV
- The mid-point of the LV is determined via the evaluation of where the myocardial walls are located
- Boundary between the endocardium and the epicardium is defined as the thickness of the myocardial wall
- The cavity of the LV is then determined by finding the end of the epicardial area via a drop off in counts. It at this at this point that the LV cavity can be initially defined
- Setting this threshold and defining its edge can done by defining the "fixed number of SD of Gaussian fitting to the myocardial profile" or
- "Predefined count threshold based on the phantom data"
- With phantom data an estimated shape of the vertical long, horizontal long, and short axis are determined along with "drawing an edge"
- Sometimes the defining of the LV boundaries is referred to as edge detection
- A problem that occurs is where there is no myocardial wall activity (heart disease)
- It is here where a phantom LV can assist in estimating where the edge should end
- The amount of pixels inside the LV cavity can now be determined and the EF can be calculated
- End-systolic (ENS) represents the bin with the least amount of pixels inside the edge detection
- End-diastolic (END) occurs where the greatest amount of pixels are located inside the edge
- Note - these pixels are actually considered voxels because they represent 3D space
- The formula that calculates %EF is noted
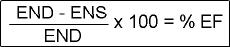
- Calculating the blood volume: Each voxel represents an amount of blood in mL. This unit or amount is then multiplied by the number of voxels in order to determine the amount of mL present in the LV.
- LVEF is underestimated with gated SPECT compared with MUGA (ERNA)
- However, when comparing MIBI and 201Tl gating to the MUGA there was a high degree of correlation between the EFs 1
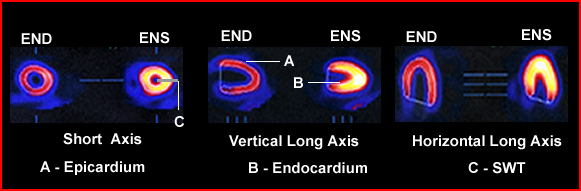
- Regional wall motion (RWM)
and systolic wall thickness (SWT)
- RWM is used to determine regional EF within the LV at different locations within LV
- SWT denotes that wall thickening defines health myocardial walls. However, to calculate the actual thickness of the myocardial wall at END cannot be visualized
- Remember that the lack of myocardial thickness is an indication of the lack of function
- At play with quantifying SWT is a problem with limited system resolution and the partial volume effect
- Myocardial wall thickness will vary between 0.5 to 2.0 cm, however, most imaging system has a limited spatial resolution of around 1.0 cm
- Furthermore, based on the principles of partial-volume with an object that is less than twice the system's resolution makes SWT calculations "impossible"
- One can note that there is a linear relationship between count density and the increase wall in which the activity should get brighter, however, do to the loss of spatial resolution you cannot quantify the SWT
- Let take an even more en-depth look at MPI quantification
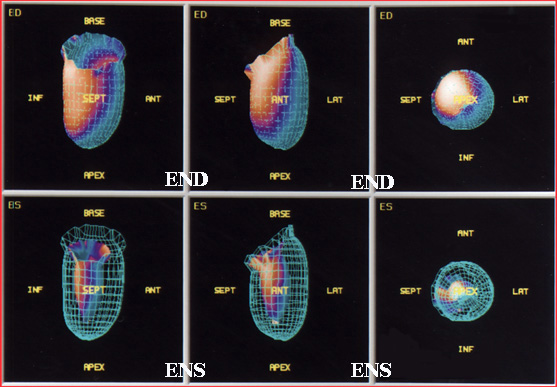
- Gating the cardiac also allows the computer to display a 3D image of the LV (see image below)
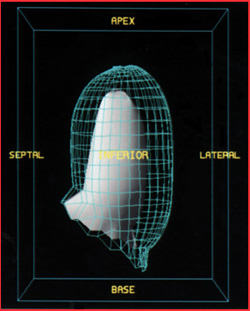
- These images may be rotated to view any angle
- Shows END and ENS
- Wall motion also occurs and therefore can be assessed
 >
>
- These image may compare END with ENS and display different angles. Unfortunately, at present, this type of cine cannot be displayed in HMTL format

- The final example shows a SPECT cardiac cine
Return to the beginning of the document
Return to the Table of Content
3/22
1 - Comparison of Tc-99m sestamibi and Tl-201 gated perfusion SPECT, by Depuey EG, et al.
1 - 201Tl and 99mTc-MIBI gated SPECT in patients with large perfusion defects and left ventricular dysfunction: comparison with equilibrium radionuclide angiography, by Manrique A, et al.
3 - A comparison of three radionuclide myocardial perfusion tracers
in clinical practice: the ROBUST study by
Kapur, A et al.
4 - Gated Myocardial Perfusion SPECT: Basic Principles, Technical Aspects, and Clinical Applications, Paul, AK, et al
Nuclear Cardiology Practical Applications by Heller and Hendel, McGraw-Hill, 2004
Nuclear Medicine Imaging Technology and Technical Aspects by ES. Crawford and SS Husain, SNMTS, 2003