Application of Cardiac SPECT Polar Mapping and 4-D Surface Rendering1
This lecture is based on a JNMT article that is referenced at the end of the page
- There are 4 software programs that will be discussed.
- AutoQUANT and Cedars blood-pool gated SPECT (BPGS)
- 4D-MSPECT
- Emory Cardiac Tool box (ETB)
- Baylor polar map package (currently not available)
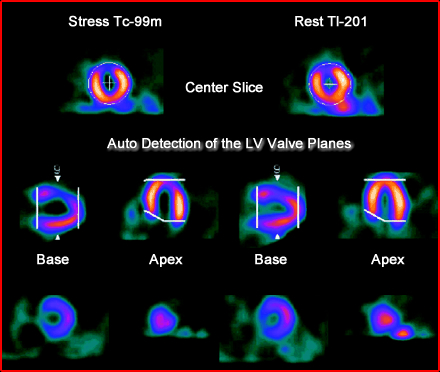
- Following cardiac acquisition auto orientation must occur to reconstruct the LV from its angular position to parallel transverse images
- Myocardium angle varies between patients
- Orientation occurs by
- Realignment of the long-axis
- To the perpendicular short-axis slice
- In the presence of disease auto-alignment may fail which requires the technologist to adjust it manually
- Hence the display above with ETB
- Segmentation adjustment
- AutoQUANT assesses the alignment and allows the user to to further refine it should the segmentation of the LV be incorrect
- There is an iterative approach to this process with each iteration slightly redefining the slices
- It identifies: extraction, threshold, clustering, and edges
- Failure in the auto approach allows the user to intervene
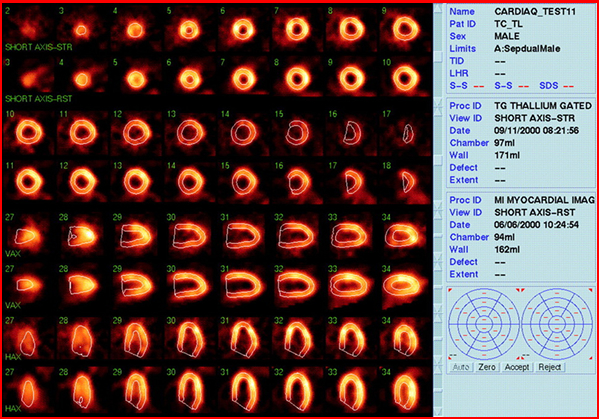
- 4D-MSPECT takes a slightly different approach with the same results
- Looks for basal and apical limits
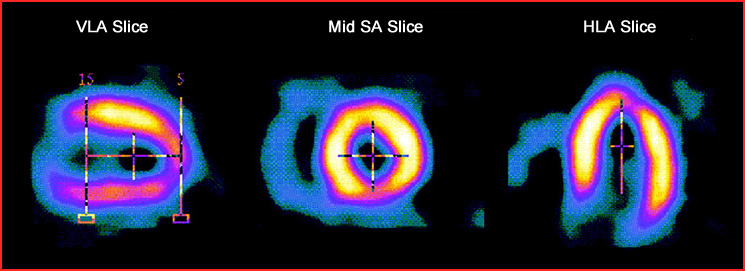
- Places the mid-slice of the short-axis, noting the cross-hairs in the vertical and horizontal long slices
- Users is allowed to adjust this parameters
- Surface rendering in 4D
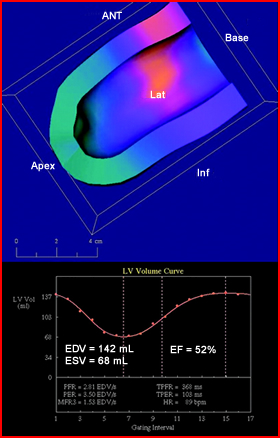
- 4D rendering evaluates the 3D slices by determining the epi/endocardial walls to assess wall motion.
- Blue area defines perfusion defects
- Within the chamber of the LV the apex to base areas that contain the empty pixels calculate the %EF and display the curve
- This 3D rendering of all slices and all beens results that can be displayed dynamically
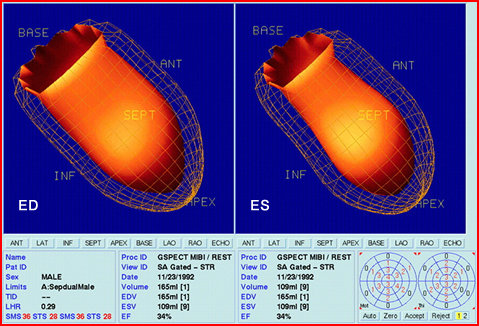
- ED and ES are noted and identify ischemic disease at the apex
- Polar map can be evaluated below
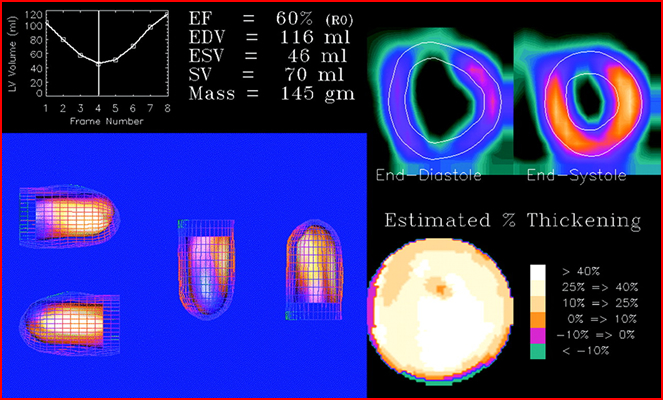
- Using the same patient data another program rendering the dynamic 4D process can be applied (ETB)
- It appears that it has a normal %EF and wall thickening drops in the ANT wall to 25 - 45%
- However, evaluating the ED and ES images shows lack of perfusion and/or wall thickening
- This area appears ischemic
- Polar map display can be evaluated below
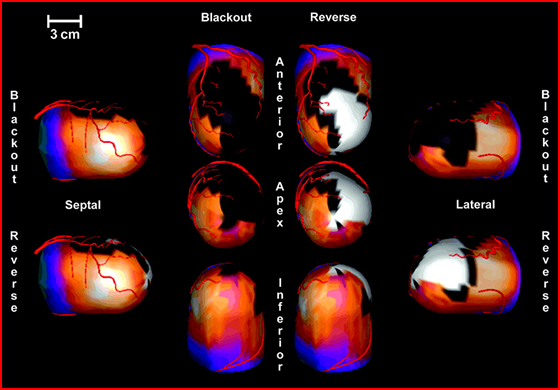
- Coronary arteries with perfusion defects seen in ETB
- Blacked out areas appear to be infarct
- Gray (reverse distribution) may be ischemic
- Overlay of arterial blood flow indicates that LAD is either very stenotic or occluded
- Polar mapping
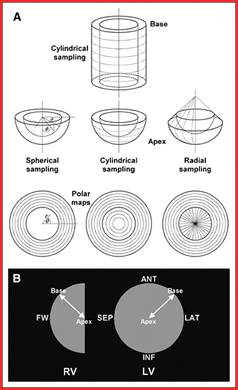
- Cedars, ETB, and Baylor
- Using 3D data base and midventriclar walls are determined and mapped using a cylindrical modal
- Apex mapping determines a spherical and radial model
- These two models are matched to the radioactive distribution resulting in a polar maps
- Orientation is the noted with the walls defined in the black box
- Apparently assessment can also be done with the RV
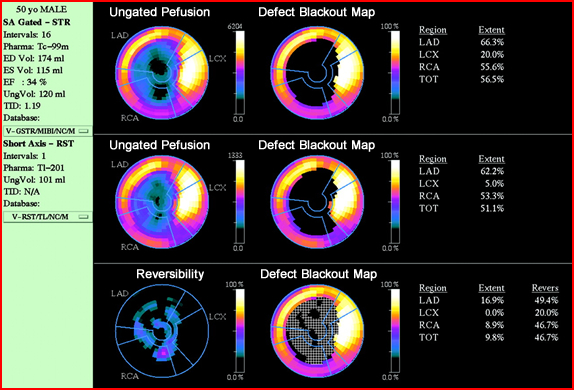
- Displaying the polar map of the disease myocardium is compared with the 2 following imaging
- Perfusion defect can be seen
- Blackout area further defines it
- Reversibility shows that most of it fills in - this is an example of?
- Scoring
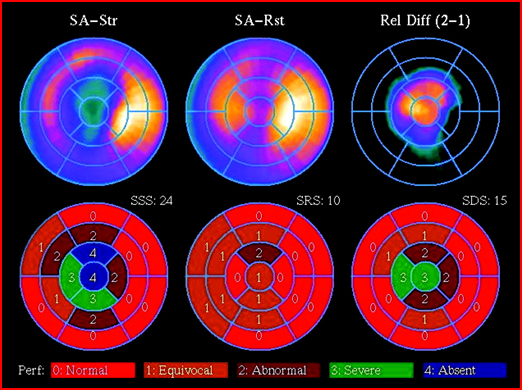
- This is a 17-sector overlay of a polar map
- Calculating the numbers
- There are 5 numerical values: 0 = Normal, 1 = Equivocal, 2 = Abnormal, 3 = Severe, and 4 = Absent
- Values are automatically determined based on the amount of perfusion
- Stress segments are then subtracted by the rest
- A net differential is then displayed via numerical values and visual display
- Another interesting point is the numerical values displayed in the total Stress (22) and total rest (10)
- Difference between the total value is 15
Return to the prior lecture
Return to Table of Content