Improving the Detection of CAD

201Tl (and 99mTc agents where indicated)
  1. Low exercise heart rate
    1. Uptake and washout are based on coronary blood flow
    2. Submaximal stress test causes reduced blood flow which relates to reduced washout rate (all agents)
    3. Stress tests that reach 85% or greater will have increased blood flow and washout rates

  2. Subcutaneous infiltration of 201Tl or 99mTc
    1. Causes slow release of into the blood stream after the patient has been stressed
    2. Reduces washout rates can occur
    3. Activity can slowly be released into the blood stream during a resting heart rate
    4. Recommend IV always be established when injecting the stress dose
    5. Nothing specificially found with 99mTc agents 3/21
    6. What might happens if part of the stress dose is infiltrated?

  3. Arm Vein Uptake of 201Tl
    1. Study showed 53% vein uptake when the dose was not injected into the medial antecubital vein
    2. Saline flush does not reduce vein uptake
    3. Results in gradual release of 201Tl into the blood stream after the patient has been stressed
    4. Lower and delayed peaking of 201Tl in the myocardium causes a slower washout rate
    5. See location of vein
    6. Nothing found with 99mTc agents 3/16, however, with in mamoscintigraphy injection (sestamibi) should be done in the opposite are of the suspected tumor

  4. Low count rate studies - all tracers
    1. Lower the count rate the greater the counting error
    2. Must have enough counts for planar and SPECT imaging
    3. Significant tissue attenuation may also reduce the amount of counts acquired for the study
    4. Consider the difference between 201Tl and 99mTc agents

  5. Inappropriate data acquisition (planar)
    1. Always acquire for the same amount of time and always image at the same angle (stress/rest)
    2. Do not increase your time for acquisition from in any of the views - would this be an issue with SPECT?

  6. Protocol deviation
    1. Always inject the patient at maximum stress and continue to stress the patient for one additional minute
    2. Variations from this critical point may cause the dose to be delivered to the myocardium without maximum hyperemia being attained
    3. Imaging sequence is also important in planar imaging and should always be: ANT, LAO 45, and steep LAO. Otherwise, a false positive washout curve may result

  7. Tetrofosmin vs sestamibi5
    1. Tetrofosmin can be images sooner with less GI activity interfering with the myocardial wall
    2. Results
      1. Imaging sooner
      2. Less repeats

  8. Compare PET agents6
    1. Reduced non-linear flow rates occur in ischemic disease. This causes reduced uptake/retension with 99mTc agents.
    2. Disease maybe 20 to 40% underestimated
    3. PET tracers tend to have a more lineary flow rate, more accurately displaying perfusion defections.
    4. This was oberved with 13N and 82Rb more

  9. Flurpiridaz, Myocardal Blood flow/reserve - To be discussed in a future lecture

Detection of Coronary Artery Disease

  1. Sensitivity and Specificity for 201Tl
    1. Planar is 83% sensitive and 88% specific
    2. Combination of the literature indicated a mean sensitivity of 86% and a mean specificity of 85%
    3. 79% sensitivity with patients that did not have a prior infarct
    4. 96% sensitivity with patient that have had a previous infarct
    5. Looking at C and D, what does that tell you?

  2. Sensitivity and Specificity of planar 99mTc-agents
    1. Planar imaging 90 and 70% respectively
    2. Quantitative and planar imaging: 90% sensitive and 75 to 80% specific
    3. SPECT quantitative results show: 87% sensitivity and 79% specificity
    4. Other literature has shown a high correlation between 201Tl and 99mTc
  3.   Exercise Adenosine Dipyridamole Dobutamine
    Sensitivity 84 88 87 91
    Specificity 87 85 81 84

  4. The table above shows the differences in MPI studies where excersize is compared to pharmacological stressing (Leppo et al.)

  5. Pharmacological MPI - by the numbers
    1. Approximately 35 to 40 percent of MPIs are done pharmacologically
    2. Dipyridamole SPECT shows 97% sensitivity and 93% specificity

        Treadmill Dip-Echo Dob-Echo DIP-MIBI Dob-MIBI
      Sensitivity 58 55 61 97 91
      Specificity 67 96 96 89 81
      Accuracy 62 73 77 93 87

  6. Comparison to treadmill, echocardiography, and pharmacologic MPI (San Roman et al.)
    1. Treadmill is EKG stress (no imaging)
    2. Dip = dipyridamole
    3. Dob = dobutamine
    4. Echo = Echocardiography
    5. MIBI = sestamibi

  7. Comparing 82RB to 99mTc-tracers - study by Bateman and colleagues7
    1. Imaging quality - PET excellent 78 and 79% vs SPECT excellent 62 and 62%
    2. Gating - PET excellent 96% and SPECT 81%
    3. Accuracy for stenosis @ 70% - PET 89% and SPECT was 79%
    4. Accuracy for stenosis @ 50% - PET 87% and SPECT 71%
    5. PET has improved accuracy in both men and women that were and were not obese
    6. PET has improved detection with multi-vessel disease (MBF/R)

  8. Referral bias occurs in nuclear medicine
    1. May increase sensitivity and reduce specificity. Why does this happen?
      1. All your positives are sent to cardiac cath and a certain percentage of these are going to be false positive.
      2. False positive data is used to calculate your specificity
      3. Few if any of your negative exams are sent to cardiac cath which generates bias in your sample falsely elevating your sensitivity
    2. The only way to truly determine sensitivity and specificity is to get a true random sample of your population
    3. Bayes theorem is another issue that indirectly relates to this and is discussed below

  9. Amount of stenosis and coronary vessels affect sensitivity
    1. Single vessel disease = 79%
    2. Double vessel disease = 88%
    3. Triple vessel disease = 92%
  10. Pharmacological stressing has similar results to treadmill stress testing
  11. Quantifying the images seems to improve sensitivity and specificity
  12. In SPECT imaging (and quantitative analysis)
    1. Sensitivity appears to increase slightly while specificity seems to decrease slightly
    2. This may be caused by referral bias
    3. One study showed that SPECT was superior
      1. In male patients
      2. Milder disease with no previous infarct
      3. Single vessel disease where the artery was 50-69% stenotic

  13. Bayes' theorem and its application in nuclear cardiology
    1. Two questions must first be considered
      1. What is the probability of the patient having disease if the results are positive?
      2. What is the probability of the patient not having disease if the results are negative?
    2. Initially determine the pre-test likelihood of disease - setup parameters
      1. Asymptomatic
      2. Chest pain = sub-sternal location, provocation by exercise, and pain relief via nitroglycerin
        1. Typical angina = all the
        2. Atypical angina = two of three
        3. Non-angina = one of three
    3. Pretest likelihood of disease affects the post-test likelihood of disease
      1. In an asymptomatic patient, pretest probability of having diseases is 5%. The results then indicate only 20% that have a positive stress test are truly positive, while less than 1% of the negatives are false negative
      2. In classifying those patients with an intermediate likelihood of CAD the pretest probability is 50%. [post test] Of those patients that have a positive test, 90% will be true positives, while those that are negative have less than 10% of being false negative
      3. High pretest likelihood (typical angina) of CAD has a 90% likelihood of disease. [post test] Of those that are positive 99% are true positive, while of those that have a negative scan, 75% are false negative
      4. Conclusion:
        1. Does a nuclear cardiology exam benefit patients with low probability of disease?
        2. When should nuclear cardiology be ordered on a patient?
        3. Of the classifications above, which group of patients receives the most benefit when Bayes' theorem is applied?
        4. What is the value of taking a patient's history?
    4. A little more information on sensitivity/specificity/accuracy
      1. True-positive = sensitivity
      2. True-negative = specificity
      3. Sensitivity + specificity = accuracy

  14. Detection of disease in coronary arteries
    1. LAD, LCX, RCA
      1. Sensitives are 69%, 37%, and 65% respectively
      2. Specific 94%, 95%, and 85% respectively
    2. Comments on why 201Tl has low sensitivity
      1. In patients with multi-vessel disease
        1. More than one area will be ischemic, however, only the more hypo-perfused area is identified. Inability to identify all the regions may relate to the variations of count density and the contrast between the different regions of perfusion
        2. The stress test may be terminated at sub-max due to ischemic developments. The area that caused the ischemic event will be identified; however, if other area(s) exist that would cause ischemia, but is/are not as stenotic as the one that caused termination of the stress test, then blood flow to the less stenotic areas may appear normal. Hence, the importance of achieving maximum heart rate is essential in order to define all ischemic areas
        3. 50% or less narrowing of a coronary does not lead to ischemia or hypo perfusion, but can be seen in angiography
        4. Collateral circulation may prevent an area from becoming ischemic
    3. Quantification of planar imaging has improved sensitivity and specificity
    4. SPECT and its role with detecting CAD
      1. LAD - 75% and 85% respectively
      2. LCX - 54% and 97% respectively
      3. RCA - 88% and 84% respectively
      4. Look at the polar map and consider the anatomy of the LV with its relationship to acquired data and detecting CAD
      5. Quantification seems to improve sensitivity, but not specificity
      6. Overall SPECT improves sensitivity, which may be due to improved contrast defining the defect via decreasing the overlapping of the myocardial walls (when compared with planar)
    5. Multi-vessel disease
      1. When all three vessels contain disease, hypo perfusion to the entire LV may show uniform uptake, and indicate a false negative study
      2. Quantitative analysis may improve the detection rate of multi-vessel disease (looks at the washout curves)
      3. One aspect to note with visual analysis is to determine if the walls to the are LV are very thin - in wall motion, is there thickening?
      4. Pulmonary uptake of 201Tl
        1. Increased pulmonary uptake can be related to left ventricular dysfunction or multi-vessel disease
        2. Draw ROIs around the lung activity at stress and redistribution
        3. Compare (ratio) to determine the extent of the washout rate from the pulmonary system
        4. Slow washout may also be due to: mitral valve regurgitation, mitral stenosis, decreased left ventricular compliance, and non-ischemic cardiomyopathy with left ventricular dysfunction

        https://www.ncbi.nlm.nih.gov/pmc/articles/PMC3282439/

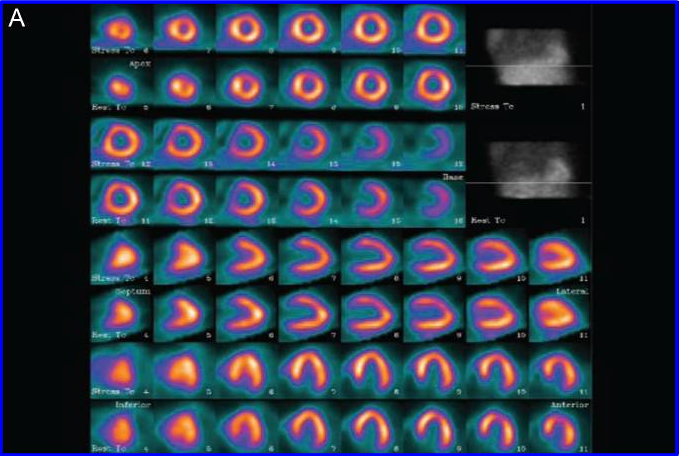
      5. Example of 3 Vessel Disease with 201Tl - abnormal EKG but normal MPI
        1. PMC3282439
        2. EF Aziz et al. - 2
      6. Transient Ischemic Dilation of the LV (TID)
        1. Multi-vessel or critical stenosis of two or more coronary arteries causes LV transient dilation
        2. Ratio of stress to rest image (negative for ischemia) is 1.02 +/- ).05
        3. Ratio of stress to rest images (two vessel disease) is 1.12 +/- .08
        4. Ratio for stress and rest images (three vessel disease) is 1.17 +/- .09
        5. What happens to TID as an increase to diseased vessels occur?
        6. There is also an association with 99mT myocardial imaging agents?
      7. Transient Ischemic Dilation presenation - Link here

  15. Assessment of myocardial viability (Tl-201) in patients with chronic CAD
    1. Studies have shown that 3-4 hour redistribution images that seem as non-reversible may become reversible in 18 to 24 hours.
    2. One study showed segmental reversibility improved following by-pass and angioplasty
    3. Another study analyzed late reversibility and identified segments that were considered non-reversible. It concluded that at least 1 segment in 53% of the patients had late reversibility
      1. Cause may be due to glucose loading
      2. OR
      3. Low regional myocardial blood flow in areas that have severe stenosis
    4. An interesting article evaluates PET, gated SPECT, MUGA, and echocardiology. It concludes that all modalities work very well in identifying myocardial viability with patients that have CAD. In addition, it appears that MUGA may be the best alternative - 3

Assessment of Prognosis

  1. Patients without MI -- predicting a future cardiac event (MI)
    1. Normal or equivocal nuclear cardiology scans have low cardiac event rates
    2. One study showed that if one or more myocardial segments had "moderate" defect(s), 10.7 out of 100 patients would have a cardiac event within a year
    3. Cardiac event rates increase exponentially with increasing severity of the defect(s)
    4. The extremes
      1. Patients with normal exercise Tl-201 stress test (reached 85% stress level) and who had a normal scan averaged a 1% cardiac event rate within one year
      2. Patients who did poorly on the stress test and had severe and extensive reversible defect averaged 78% cardiac event rate within one year
    5. Comparing medical treatment to by-pass surgery, only patients that had two or more reversible defects reduced his/her cardiac event rate if treated with by-pass surgery. Patients that had only one reversible defect that were treated via medication or by-pass surgery indicated that neither method reduced the cardiac event rate
    6. Size of the defect also correlates to the probability of a cardiac event. The larger the defect, the greater an event is likely to occur.
    7. Other indications of increasing the cardiac event rate include: Tl-201 pulmonary uptake, heart-to-lung ratios, history of typical angina, prior MI, and exercise ST segment depression
    8. Another study suggested that the two most significant predictors to a cardiac event were: (a) the number of vessels that were stenotic (>/= 50%) and (b) the amount of Tl-201 segments that had reversible defects
    9. Summary on event rates 2007 article4

  2. Patients with MI -- predicting a future cardiac event
    1. One study showed that if two non-reversible defects, coupled with the presence of reversible defect and abnormal heart-to-lung ratio with Tl-201 were highly predictive of a cardiac event
    2. In a study, where dipyridamole was used to stress the patient, Tl-201 was administered to patients that had a previous MI. Of the 33 patients that had reversible defects, 11 died or had a recurrent MI during the following 19 month. Only one patient of 18 (6%) had a cardiac event, in which the dipyridamole study identified no reversible defects
    3. Finally, sub-maximal exercise using a treadmill was performed with a small group of patients, who were then subsequently administered with dipyridamole Tl-201. Results indicated that the dipyridamole/Tl-201 was a better predictor of a cardiac event as compared to just the exercise electrocardiogram

Return to the beginning of the document
Return to the Table of Contents


http://en.wikipedia.org/wiki/File:Gray574.png
Note location of medial antecubital vein (vena mediana cubiti)

1 - Transient ischemic dilation for coronary artery disease in quantitative analysis of same-day sestamibi myocardial perfusion SPECT by Xu Y, et al.

2 - Triple vessel coronary artery disease presenting as a markedly positive stress electrocardiographic test and a negative SPECT-TL scintigram: a case of balanced ischemia by EF Aziz, et al.

3- Comparison of LVEF assessed by 2D echocardiography, gated blood pool SPECT, 99mTc tetrofosmin gated SPECT, and 18F-FDG gated PET with ERNV in patients with CAD and severe LV dysfunction by R Senthil, et al.

4. The Prognostic Value of Normal Exercise Myocardial Perfusion Imaging and Exercise Echocardiography by LD Metz, et al.

5. Efficiency comparison between 99mTc-tetrofosmin and 99mTc-sestamibi myocardial perfusion studies by Ravizzini GC, et al.

6. Radionuclide Tracer for Myocardial Perfusion Imaging and Blood Flow Quantification. by deKmp RA, et al.

7. Diagnostic accuracy of rest/stress ECG-gated Rb-82 myocardial perfusion PET: comparison with ECG-gated Tc-99m sestamibi SPECT. by Bateman TM, et al.


A major portion of these lecture was attained from Nuclear Cardiology Practical Applications, By GV Heller and RC Hendel 2nd edition

3/21