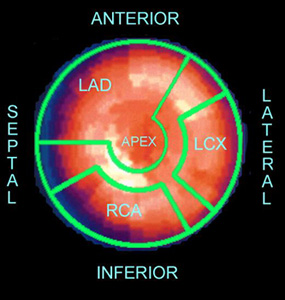
Processing a Bullseye or Mapping the LV - Microdelta Protocol

cardiacmaplabel.jpg - 46321 Bytes
  1. Prior to starting any Bullseye or Polar Map processing one must first complete the reconstruction of the tomographic images
  2. After tomographic processing, the reconstruction data is ready for bullseye processing
    1. Comment - Selecting the slices to process, stress and rest, must represent the exact same area of the myocardium. Not selecting the same comparative regions or slices, will result in an inability to assess the same region
      1. Rotated map between stress and rest shifting the region. As an example, if a cold defect on stress shifts in the rest image the area on the rest might be defined as having infarct and ischemia
    2. Bullseye procedure (see image below)
      1. Center slice for the Short Axis
      2. "A" selects the short axis slice
        1. Select the center slice form the short axis
        2. Note that all slices of the short axis, apex to base, are displayed for both stress and rest images
      3. "B" setting the sagittal limits
        1. The two regions are selected from the extreme medial ends of the short axis of the endocardium
        2. This should not be any activity within the base or posterior walls. Another words, you are defining the chamber within the LV
      4. "C" setting the oblique limits
        1. The first region is set to go perpendicular through the myocardium and crosses the center of the LV cutting across the apex to base of the LV
        2. The second set of regions
          1. The first region is drawn just above the apex, not to include the wall of the apex
          2. The second region is drawn just within the inferior and anterior wall which should include just a little activity from both walls
      5. "D" the alignment angle
        1. A circular is placed around the short axis
        2. Arrange the radius to include the entire short axis
        3. This alignment must also be at the center of the short axis
      6. Processing is completed
      7. Comments on Bullseye processing
        1. If there are any defects within the myocardium processing becomes more difficult as you try to line up regions (stated above) especially when walls are missing. This may require a best guess that could lead to error
        2. Processing is operator depending. Any minor mistakes, may drastically alter the resultant data
        3. Any disease seen on a polar map should be confirmed by reviewing the reconstructed data

    processbullseye.jpg - 77569 Bytes


  3. Reviewing the Bullseye maps
    1. The first set of maps (stress and rest) show which coronary arteries feeds which wall of the LV
    2. The second set of images shows the processing results of stress and rest images
    3. To the right is a display of abnormal percents for each coronary artery
    4. Also to the right is a gray scale to help assist the severity of disease. The greater the deviation of each pixel within the polar maps the greater the abnormality
    5. What areas of the myocardium are considered abnormal?
    6. Is there ischemia, infarct, or both?
    7. If there is/are any defects, which walls within the myocardium are they?
  4. More on - parts of a polar map
    1. Consider this a myocardial map of the LV
    2. The center of the map is the apex (or tip) of the LV with the four sides of the LV appropriately labeled around the LV
    3. The map has also been labeled with the different myocardial arteries that feed LV and the anatomical structures

      Coronary Arteries

      Anatomical Structure of the LV

      LAD - Left Anterior Descending

      Septal Wall

      LCX - Left Circumflex

      Anterior Wall

      RCA Right Coronary Artery

      Inferior Wall


      Lateral Wall

    1. The next image (above) shows the Bull's Eye for stress and redistribution
    2. To the right of the stress and rest images is a gray scale that is a scale represents the amount of activity in each pixel, white containing the highest counts and black containing the least
    3. If the pixel variation is greater than 2.5 SD then it appears dark-gray or black
    4. Greater than 2.5 SD indicates complete lack of uptake within that region of the heart
    5. Should a dark region be present only in the stress, but fills in at rest, then ischemia is diagnosed
    6. If the dark region is seen in both stress and redistribution, then infarct is considered
    7. Myocardial map shows the location of the defect and which coronary artery (or arteries) is/are involved. The only problem with this is that a high degree of patients have variations of myocardial artery location
    8. Is BE = BS? Always look back at the tomographic images to confirm any possible defect seen in a Bull's Eye!

    17 Segment Polar Map

    17 Segment Polar Map

    Analysis of the 17 Segment Polar Map
    1 - Basal Anterior
    LAD
    7 - Mid Anterior
    LAD
    13 - Apical Anterior
    LAD
    2 -Basal Anterior Septal
    LAD
    8 - Mid Anterior septal
    LAD
    14 - Apical Septal
    LAD
    3 - Basal Inferoseptal
    RCA
    9 - Mid Inferoseptal
    RCA
    15 -Apical Inferior
    RCA
    4 - Basal Inferior
    RCA
    10 - Mid Inferior
    RCA
    16 - Apical Inferior
    LCX
    5 - Basal Inferolateral
    LCX
    11 - Inferolateral
    LCX
    17 - Apex
    LAD
    6 - Basal Anterolateral
    LCX
    12 - Anterolateral
    LCX

    A more intensive approach is to subdivide the polar map into 17 Segments.

Finally a link for 3D display of myocardial blood flow distribution: http://www.yale.edu/imaging/anatomy/heart_sa_view/index.html

    Methods for Evaluating Left Ventricular Function Computed from ECG-Gated Myocardial Perfusion SPECT

Return to the beginning of the document
Return to the Table of Contents