- Glomerular Filtration Rate (GFR)
- As blood and plasma pass through the glomeruli, approximately 20% of the plasma is filtered out (~120ml/minute). The best radio-tracer for quantifying GRF is 99mTcDTPA. Only 3 to 5 % of this agent is protein-bound, which results in a small error in the GRF value (if the error is known then this can be added to the calculation). An increase in rennin flow increases protein binding will falsely lower the GFR. Effective T1/2(s) for DTPA are: 10, 90, and 600 minutes
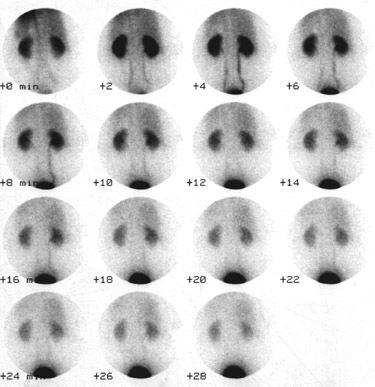
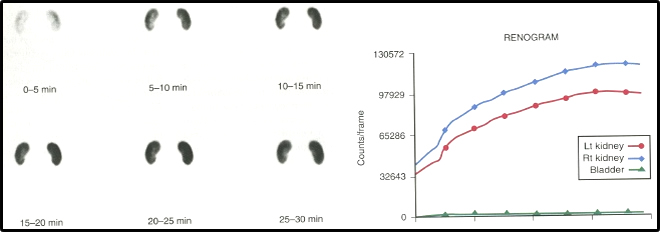
- The dynamic imaging procedure is used to identify the passage of the radio pharmaceutical through the kidneys to the urinary bladder
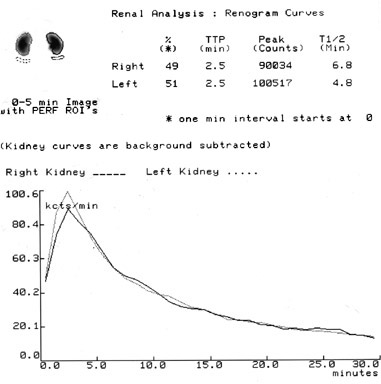
- Quantitatively, ROIs are drawn around the kidneys and a time/activity curve is generated. The end result it so displays renal function of the radiotracer as it passing through the kidneys
- Usually, there are two components regarding ROIs with imaging quantification. First is a 2-sec per image acquired for 1 minute. This portion assesses initial renal uptake. The second component acquires 1-minute images for 20 to 30 minutes. ROIs are drawn to evaluate the passage of the radiotracer through the kidneys
- Effective Renal Plasma Flow (ERPF)
- Identifies the amount of plasma that reaches and is filtered by the kidneys. Generally the normal range is around 600 mL/minute. 99mTcMAG3 has become the agent of choice as a tubular plus GFR excretion to determine ERPF. Clearance depends on the extraction efficiency and the blood flow to the kidneys. Then maximum concentration in the kidney is 3 - 5 minutes with 50% remaining at 7 - 10 minutes
- Just like the above (GFR), quantitatively, ROIs are drawn around the kidneys, and time/activity curves are generated, which displays renal function as the radiotracer passing through the kidneys. See images below
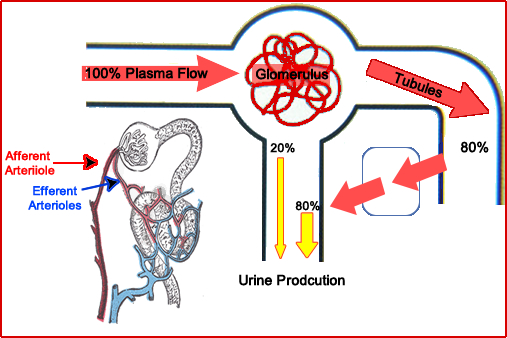
- Here is a diagram showing the application of ERPF and GFR, showing the production of urine
- Radiotracer perfuses into the kidneys and is retained by the renal cortex allowing for examination of renal anatomy
- This radiopharmaceutical will identify space-occupying lesions and the agent of choice is 99mTcDMSA. Considered parenchymal imaging this agent is 90% bound to serum protein and ~50% adheres to the renal tubules. This occurs in about 1-hour post injection
- Time/activity curves are not drawn since all we are looking at is anatomy. Lack of uptake within the kidney is an indication of some type of lesion
- Perfusion and quantification agent
http://www.kjim.org/journal/view.php?number=15305
- 99mTc-glucoheptonate (GH) can be used for cortical imaging and renal function. 50% is bound to the plasma protein Tubules and glomeruli both extraction about 50/50 and 10% binds to the renal cortex at 1 - 2 hours post dose. Early analysis of the renal procedure yields function, however, delayed images defines renal anatomy
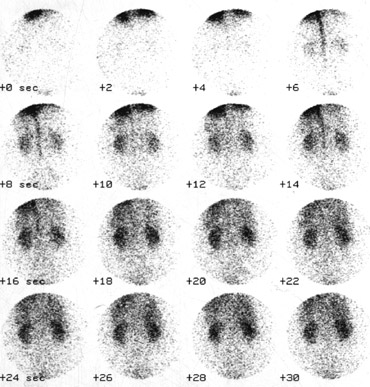
- Usually, two sets of dynamic images are taken
- The first set is acquired at 2-3 seconds per frame for about 1 minute
- Purpose: Assess initial uptake of tracer in the kidneys - do the kidneys "light up" when the radiotracer goes down the descending aorta?
- The second set is then collected at 30-60 seconds per frame and goes for 20 to 30 minutes
- Purpose: evaluate the overall renal function as the tracer passes through the renal cortex, generates radio-urine that passes through ureters and into the urinary bladder
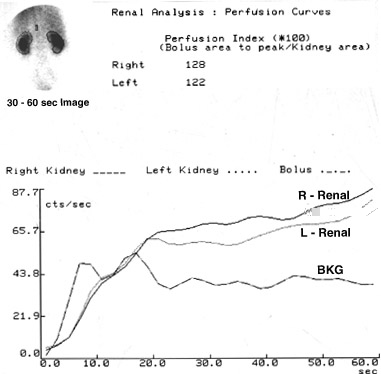
- The example shown identifies how ROIs are used in a renal scan. Three ROIs are drawn. One ove reach kidneys and on over the descending aorta
- Time-activity curve shows the kidneys "lighting up" as the radiotracer passes the descending
- Usually, this portion of the dynamic procedure is acquired at no more than 2-3 seconds per frame. Acquisitions last for about a minute.
- The second part of this dynamic procedure acquires data for 20 to 30 minutes
- While there are several different applications on how to draw these ROIs, however, in our intro class let's just draw these regions around the entire kidney (L and R)
- At the lower pole of each kidney background, ROIs are placed. Time activity is generated
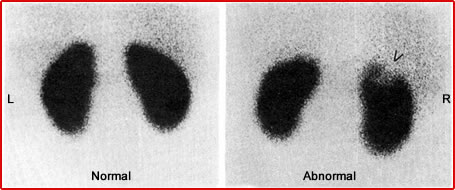
- This is a normal imaging procedure. Can you tell me why?
- There is alot that I could add to this topic, but let's wait till next summer to cover the details
- Renal scans are also augmented with Lasix or ACE inhibitors which is another topic for next summer
 |
 |
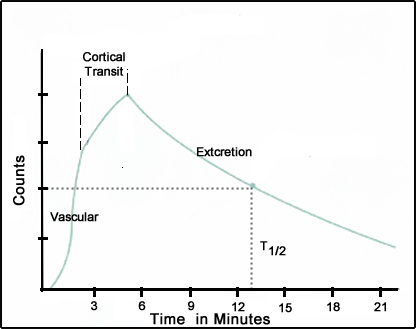
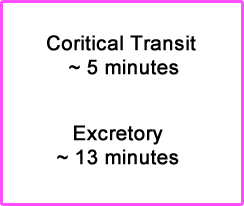
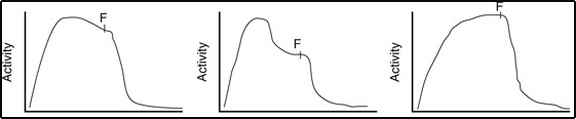
- The parts of the time/activity curve are identified: vascular, cortical transit, and excretion
- Identify the times in each phase, but concentrate on the cortical transit and excretion. Is everything normal?
- Here is an example of complete blockage. Lasix was not given, which means that it is an incomplete assessment of renal function. Notice how the kidneys continue to get darker indiciating that activity is not leaving the kidneys. This corresponds to a time/activity curve that does not have a negative down slope
- In order to determine if there is a blockage, a diuretic is given. Lasix generates a urinary bolus causing an excess production of urine, pushing a large amount of urine to be pushed out of the urinary pelvis. If a blockage were present, the activity would continue to build
https://radiologykey.com/imaging-techniques-4/
![]()
- SPECT is in many ways very much like a CT scan in radiology. It uses the same "type" of technology to acquire and develop 3D imaging
- The differences are: 1) where the radiation originates, (2) we look at physiology, (3) Imaging time takes longer, and (4) the resolution is nowhere near that of CT
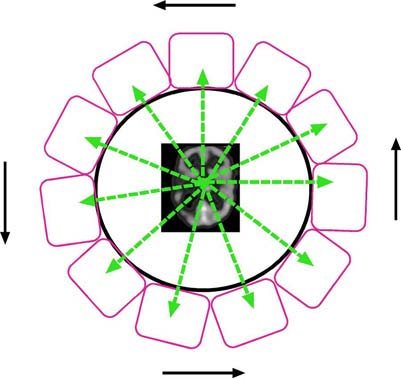
- The above image shows how a detector or a set of detectors collect information 360 degrees around the organ of interest
- A SPECT system can have one two three detectors
- The following acquisition parameters are used to collect data on a brain scan (this data may)
- 64 to 128 stops (in a 360 degree rotation)
- 30 or fewer seconds per stop
- 64 by 64 or 128 by 128 matrix
- CT scan matrix is 512 or 1024
- When you compare matrix sizes, what do you think about the resolution between CT and SPECT?
- Once the data is collected it can be displayed in a cine
- In this case a 64 by 64 matrix of a brain scan collected 64 slices, 360 degrees around the patient at 25 second per slice
- This defines your raw data which now requires processing either by filtered backprojection or iterative reconstruction
- Filtered backprojection (FBP)
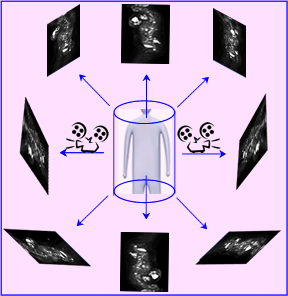
- As defined, the images are projected back by the detector that gives you a 360-degree display
- These images are filtered to remove: noise and background
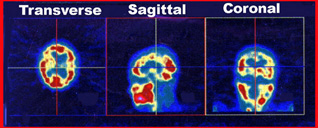
- Then three sets of images are generated: transverse, coronal, and sagittal
- A more in-depth discussion will occur during CLRS 322
- Regarding iterative (IR): it is mainly used in PET (however, becoming more popular in SPECT). Unlike FBP, IR attempts to estimate the exact amount of counts per pixel/voxel. More detail will be given in your physics and instrumentation class
- Generating 3D information - (processing the data)
- 3D data is acquired by backprojecting all 64 images and assessing them in a complicated algorithm
- The results are a sum of all projections respective to all angles (64) allows for processing new images at any angle (different slices)
- Usually the angles are: transverse, sagittal, and coronal
- It is important to realized that the concept presented today is very basic
- Images are also filtered to reduce noise (smoothing) and remove background so that data can be better assessed
- From the above rotating SPECT images the three types of slices are displayed
- It should be noted that these slices above are only 2 pixels thick and for each type of slice (transverse, sagittal, and coronal) there are approximately 20 projections per type of projection
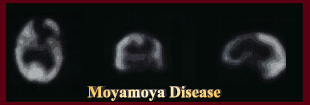
- Note the lack of uptake in the frontal lobe of the brain
- Moya Moya disease is usually a childhood disease that is caused by the lack of blood flow to certain parts of the brain