- Positioning
- Personnel preference based on equipment available
- My suggestion, based on a two-headed camera system, if the patient can be imaged upright, then this would be the method of choice, taking both anterior and posterior images at the same time
- Image acquisition and correction for decay
- Following the administration of a radioactive meal, preferably solid, ANT and POST images are taken immediately after the patient has eaten
- Initial images are labeled as zero time
- Regions of interest are drawn over the stomach in both images and the counts are recorded
- ANT counts and POST counts are used to determine the geometric mean using the above diagram
- As an example, let’s say that ANT counts = 20,500 and POST counts = 21,500.
- Applying the geometric mean formula would give you a value at time zero of 21,994 counts
- Images are then taken every 30 minutes for up to 2.5 hours
- ROIs are then drawn over the ANT and POST stomach and counts are recorded
- Using the above diagram, again determine the geometric mean for each set of images taken
- These counts must then be relate (decayed) back to time zero
- How is this done?
- It is important to realize that you must decay back to the past, to time zero, which means you have to divide geometric mean by the appropriate decay factor
- Several clinics have known to multiple the geometric mean by the decay factor – Don’t Do This!
- Applying the correct approach the geometric mean is calculated and then the decay factor is applied
- Notice from the formula that the technetium decay factor is divided into the geometric mean, which allows you to relate the time in which the images where taken back to zero time
- As an example, if you have a geometric mean of 10,000 counts and an hour has passed from time zero, then the decay factor is 0.891
- The one hour decay factor is then divided into 10,000 counts giving you a value of 11,223 counts
- Now you need to determine the gastric emptying time at 1 hour
- Using the examples given above and noting the diagram, you must divide 11,223 counts into 21,994 counts and then multiple by 100
- This value is 51%, which means that this is the amount of the radio-meal that remains in the stomach
- To determine the amount emptied apply the above example
- Hence, 100% - 51% = 49% emptied
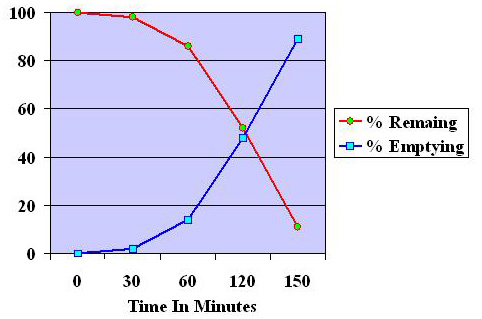
- For each ANT/POST counts collected you must determine what the % emptying is by applying the above examples for each time collected
![]()
![]()


![]()
- The above images show images and ROIs from a procedure in which a patient consumed 855 μCi of Radio Colloid eggs. Images were taken immediately after the meal was eaten and then every ½ hour for 2.5 hours
- Not all images are displayed, however, appropriate data is displayed as a sample study

Example of Gastric Emptying Calculations
Review the calculations below – you will see them again
Times and decay factors |
Anterior cts |
√Ant x Post |
Current Time x100 |
% Remaining |
% Emptied |
Posterior cts |
|||||
0 Minutes (df – 1.000) |
A = 31.0 k |
√1553 k/1.0 |
39.4/39.4 x 100 |
100 |
0 |
P = 50.1 k |
|||||
30 Minutes (df – 0.944) |
A =31.5 k |
√1499 k/0.944 |
41/39.4 x 100 |
104 |
0 |
P =47.6 k |
|||||
60 Minutes (df – 0.891) |
A = 44.7 k |
√1153 k/0.891 |
38.1/39.4 x 100 |
96 |
4 |
P = 25.8 k |
|||||
120 Minutes (df – 0.794) |
P =10.7 k |
√266 k/0.794 |
20.5 k/39.4k x100 |
52 |
48 |
A = 24.9 k |
|||||
150 Minutes (df – 0.750) |
P =1.8 k |
√10.8 k/ 0.750 |
4.3 k/0.75 x 100 |
11 |
89 |
A = 5.7 k |

Gastric Emptying Work Sheet
Return to the Table of Content
7/21