CHEM L110 - Chemistry and Society Laboratory
INTRODUCTION
The sun's energy reaches the earth in the form of
electromagnetic radiation. Electromagnetic radiation travels from the sun to the earth as
a wave at the "speed of light" (3.0 x 10⁸ m/s). The different forms
of electromagnetic radiation (e.g. microwaves, infrared, x-rays, etc.) are characterized
by their wavelength (![]() ), frequency (
), frequency (![]() ), and energy. One common form of electromagnetic radiation is visible
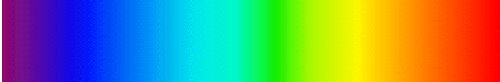
light. Visible light is characterized by wavelengths between 700 nm (red) and 400 nm
(violet). 1 nm (nanometer) = 1 x 10⁻⁹ m. We have all seen a beautiful rainbow
after a thunderstorm. A rainbow forms when visible light passes through raindrops and is
separated into its component colors (ROYGBIV). You can produce
your own rainbow by either passing visible light through a prism or reflecting it off a
grating. A spectrophotometer
is an instrument used to measure the interaction of matter with light.
), and energy. One common form of electromagnetic radiation is visible
light. Visible light is characterized by wavelengths between 700 nm (red) and 400 nm
(violet). 1 nm (nanometer) = 1 x 10⁻⁹ m. We have all seen a beautiful rainbow
after a thunderstorm. A rainbow forms when visible light passes through raindrops and is
separated into its component colors (ROYGBIV). You can produce
your own rainbow by either passing visible light through a prism or reflecting it off a
grating. A spectrophotometer
is an instrument used to measure the interaction of matter with light.
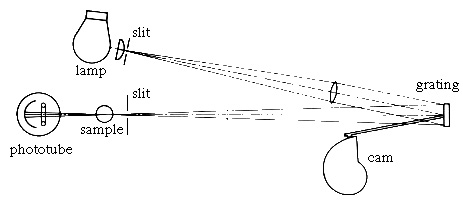
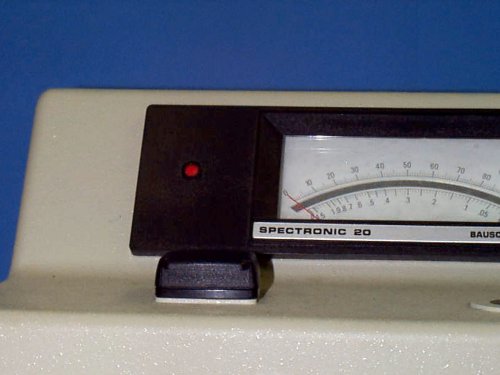
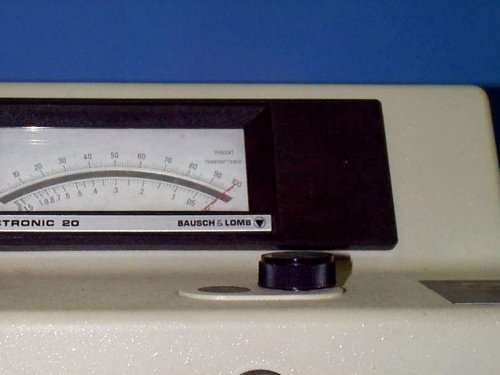
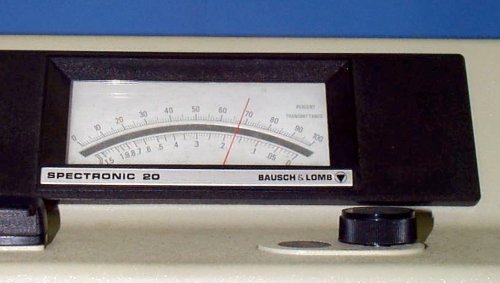
In the spectrophotometer visible light from the lamp is both separated into its component colors and reflected towards the sample by the grating. The phototube detector measures the amount of light of a particular wavelength that is transmitted or absorbed by the sample. The meter on the spectrophotometer displays percent transmittance (%T).
![]()
%T represents the amount of light of a particular wavelength that passes through the sample. A high %T means that a lot of light of a particular wavelength passes through the solution. A low %T means that most of the light of a particular wavelength is being absorbed by the solution and only a small amount of the light passes through it. The solution color that you see comes from the wavelengths of light with high %T.
In the first part of this experiment you will observe and then assign colors to the the different wavelengths of visible light. In the second part of this experiment you will determine the %T of light of different wavelengths for both a blue and a red solution. You will graph this data (%T versus wavelength) to obtain the transmittance spectrum for each solution. Finally, you will predict what the transmittance spectrum of a green solution looks like and then experimentally measure it.
EXPERIMENTAL PROCEDURE

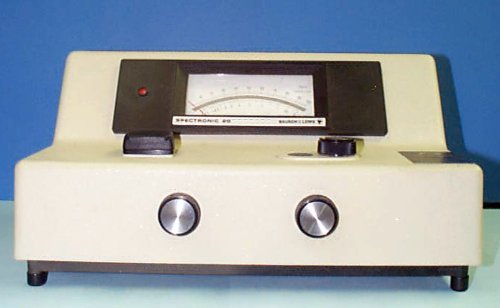
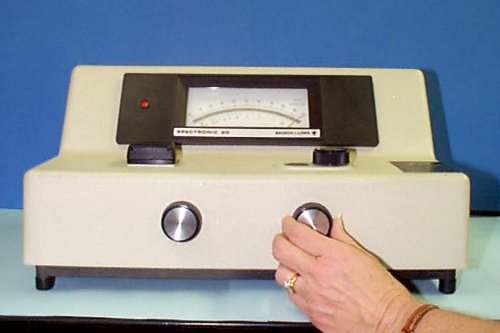
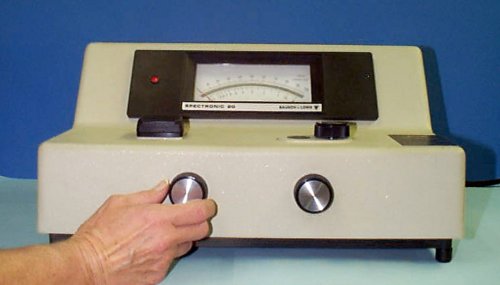
Spectronic 20 Spectrophotometer
I. Colors and Wavelengths
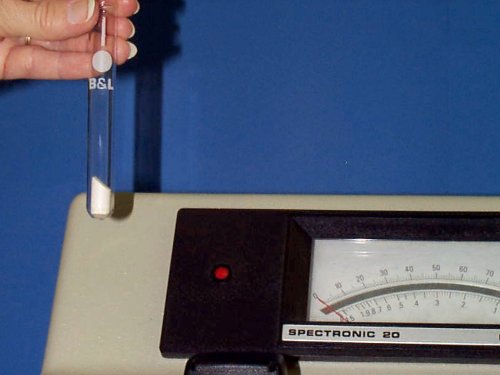
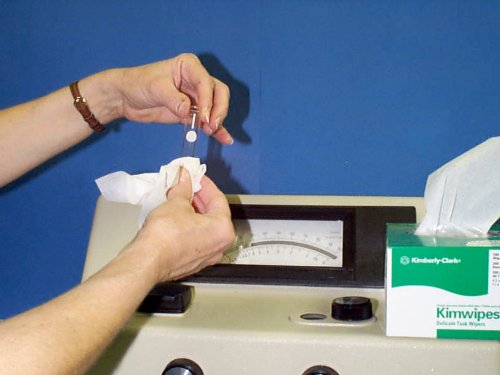
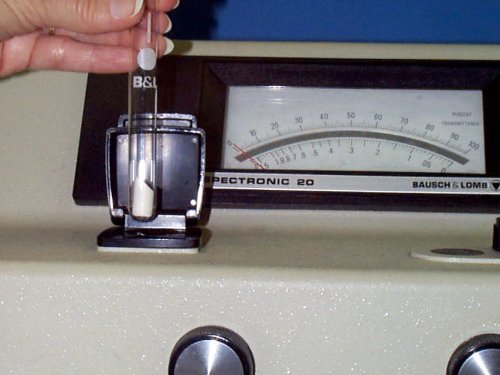
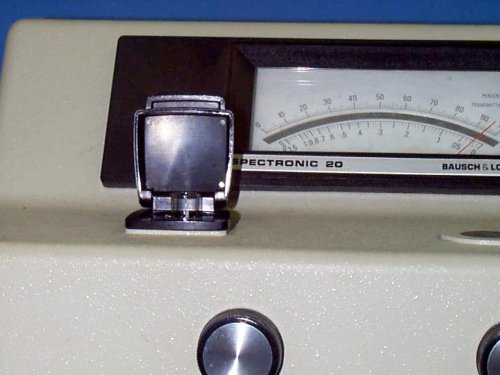
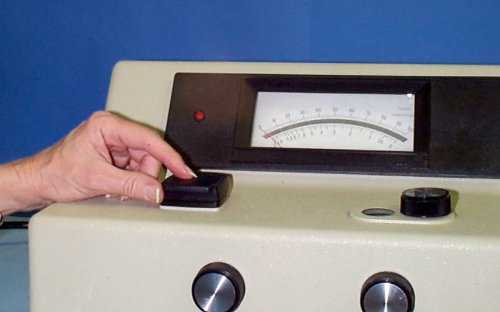
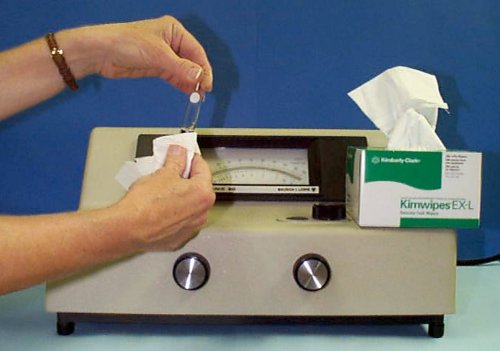
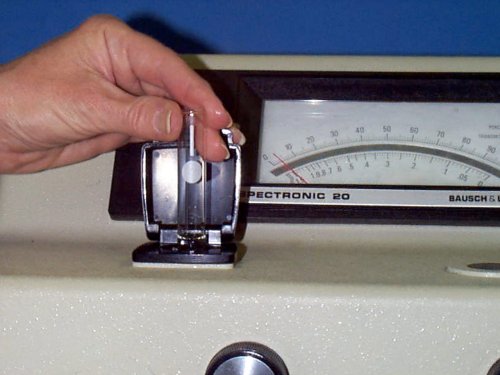
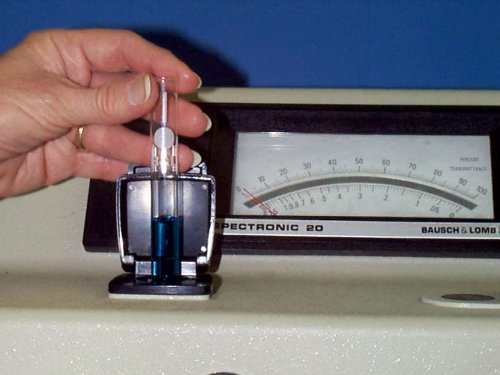
1. Obtain a cuvette that contains a small piece of chalk. Wipe the outside of the cuvette with a "kimwipe" tissue. With the slanted surface of the chalk facing to the right, insert the cuvette into the spectrophotometer sample compartment. The colors of visible light will be observed on the slanted chalk surface.
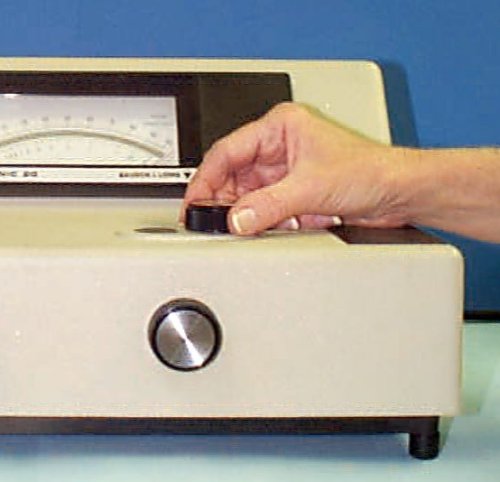
2. Set the wavelength dial to 550 nm. Turn the 100% transmittance dial all the way clockwise.
3. With the sample compartment door open, look down the cuvette on to the slanted surface of the chalk. You should see a band of colored light. If you don't, try to reposition the cuvette. Ask your instructor for help if needed.
4. Set the wavelength dial to 400 nm. Look at the chalk in the cuvette. Record the color you see in the table on the report sheet. Increase the wavelength to 425 nm. Look at the chalk in the cuvette. Record the color you see. Continue this procedure by increasing the wavelength by 25 nm each time until you reach 700 nm. Record a color for each wavelength.
II. Transmittance Spectra of Blue and Red Solutions
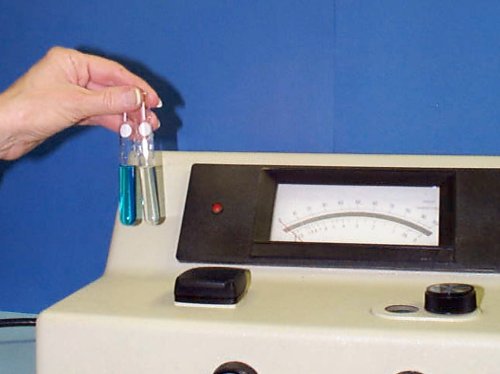
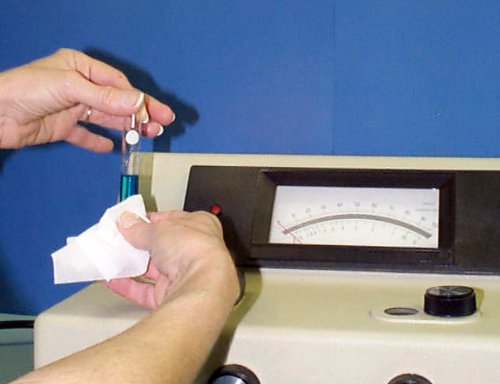
1. Obtain two cuvettes, one filled with a blue solution and the other to be filled ~half full with deionized water. The cuvette with the water is your "reference blank".
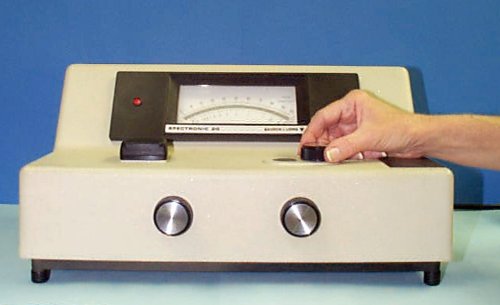
2. Before you begin, you must set zero %T on the spectrophotometer. The sample compartment must be empty and the cover closed. Adjust the left front dial (zero dial) until the needle on the meter reads exactly 0 %T. Note that the meter has a mirror behind the needle. For a correct reading of the %T, the mirror image of the needle should line up directly behind the needle itself.
3. Wipe the outside of the "reference blank" cuvette with a "kimwipe" tissue. Place this cuvette in the sample compartment and close the cover. Set the wavelength to 400 nm. Adjust 100 % transmittance using the right front dial until the meter reads 100 %T.
4. Remove the "reference blank" cuvette. Wipe the outside of the cuvette containing the blue solution with a "kimwipe" tissue. Place this cuvette in the sample compartment and close the cover. Do not change any settings. Read the %T and record it in the data table for the blue solution at 400 nm.
5. Change the wavelength to 425 nm. Remove the sample and replace the "reference blank" in the sample compartment. Close the cover and again adjust the meter to read 100%T by turning the right front dial. Remove the "reference blank" and replace the cuvette with the blue solution in the sample compartment and close the cover. Do not change any settings. Read the %T and record it in the data table for the blue solution at 425 nm.
6. Continue with this procedure (step 5) every 25 nm until you reach 700 nm.
7. Graph your data to obtain the transmittance spectrum for the blue solution. Wavelength is on the x-axis and %T is on the y-axis. Draw a smooth curve through the data points. The curve does not have to touch every point.
8. Next, repeat the entire procedure (steps 2 - 6 above) using the red solution.
9. Graph your data to obtain the transmittance spectrum for the red solution.
III. Transmittance Spectum of a Green Solution
1. Locate the wavelength region of maximum transmittance for your blue solution. Note the colors of the visible spectrum associated with the wavelengths in this region.
2. Locate the wavelength region of maximum transmittance for your red solution. Note the colors of the visible spectrum associated with the wavelengths in this region.
3. Using these observations, draw what you would expect for the transmittance spectrum for a green solution.
4. Obtain a cuvette containing a green solution. Follow steps 2 - 6 in Part II above to obtain %T data for the green solution.
5. Graph your data to obtain the transmittance spectrum for the green solution. Compare your predicted spectrum with the actual one. How good did you do?