CROSSTABULATION IN SPSS
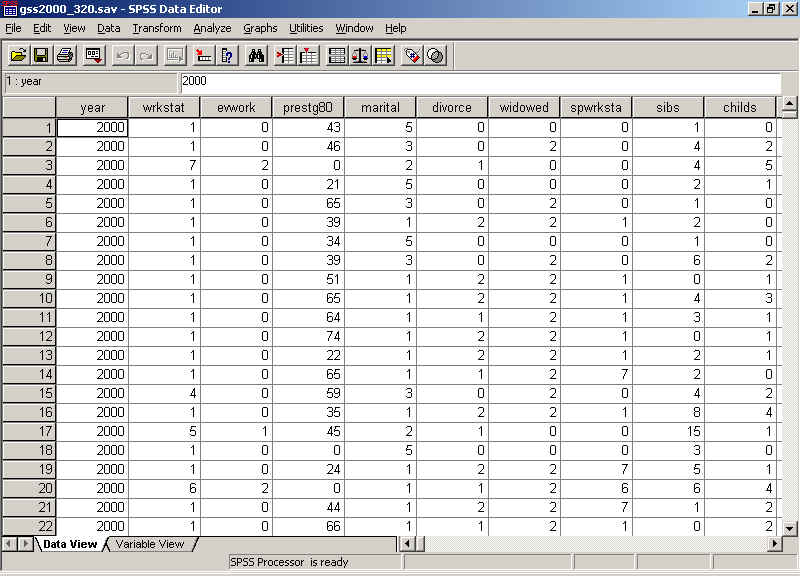
First, open your data set. I'm showing gss2000_320.sav in Data View:

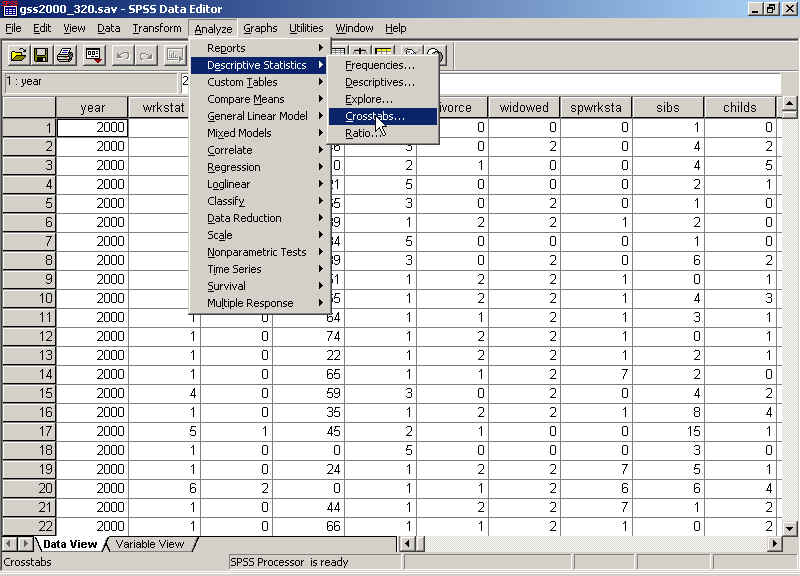
You'll need to decide which variable in your analysis you consider to be the independent variable and which you consider to be the dependent variable before doing the crosstabulation procedure. In this example, I'm using race as the independent variable and cappun as the dependent variable. On the menu bar, click Analyze... Descriptive Statistics... Crosstabs:
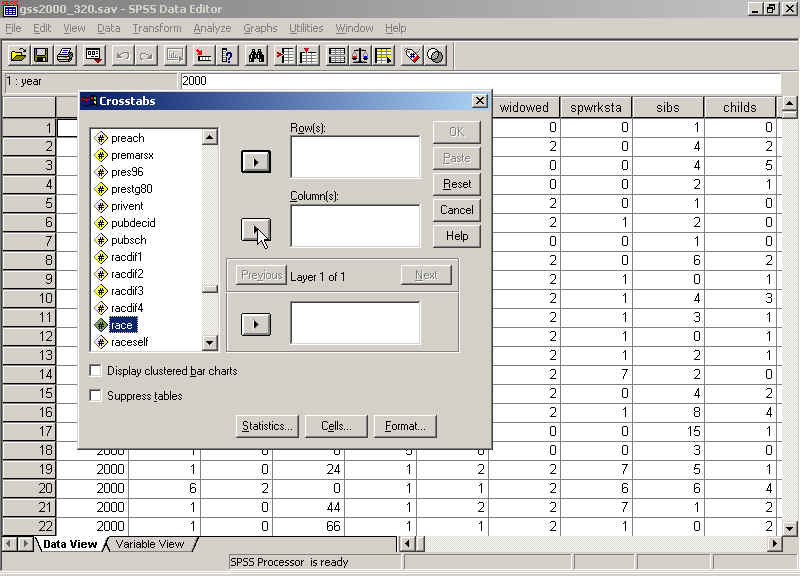
In the Crosstabs dialog box, click your independent variable on the variable list (race, in this case) and click the arrow to move it to the Column box:
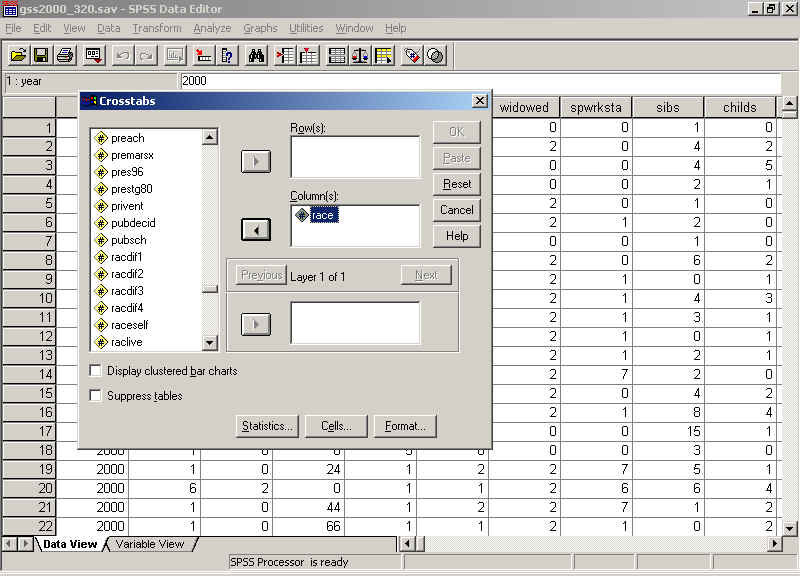
Then your screen should look like this:
Find your dependent variable on the variable list (cappun in this case) and move it to the Row box:
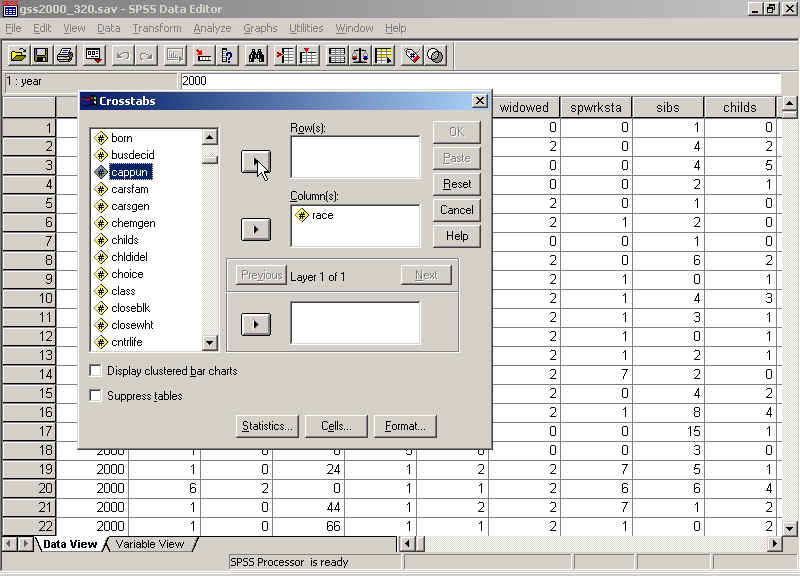
Your screen should now look like this (with different variables, of course):
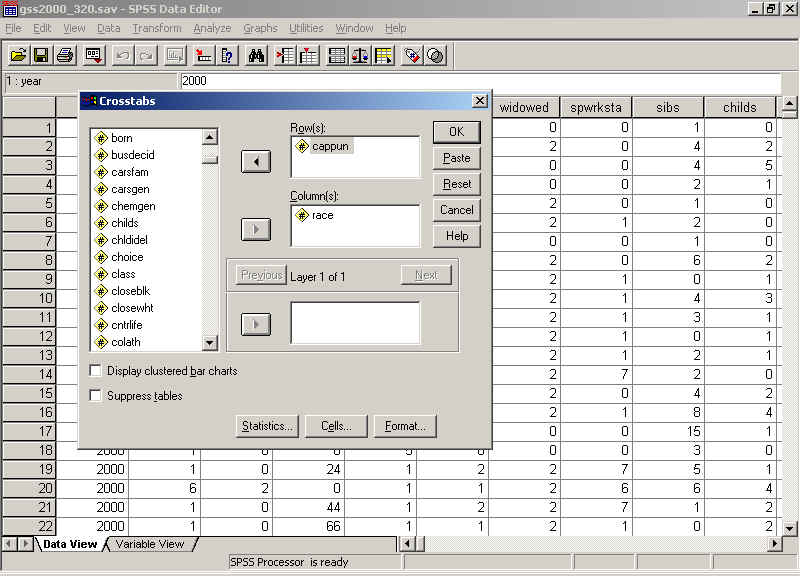
In order to properly interpret your analysis, you will need to obtain column percentages. To do this click Cells:
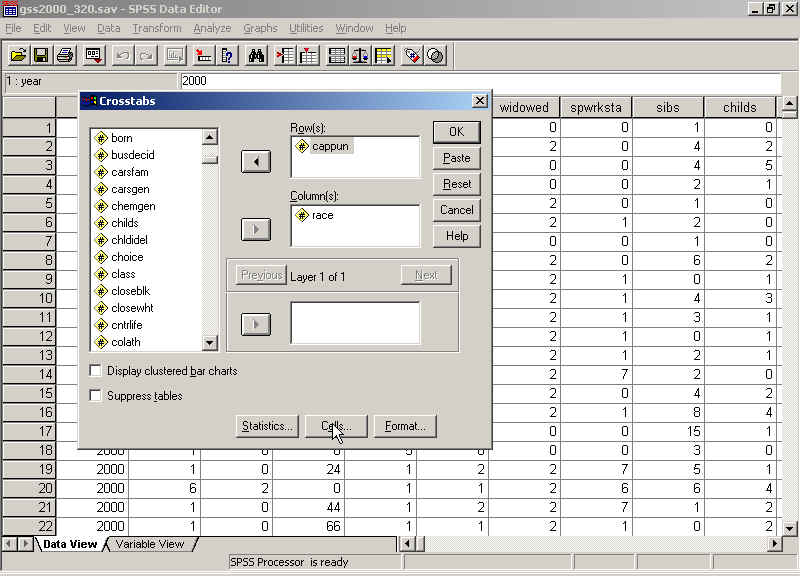
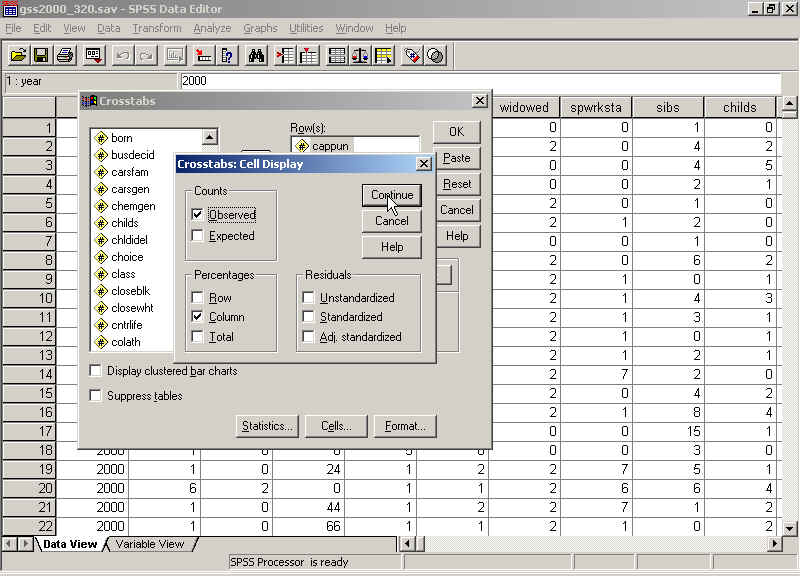
In the Cells dialog box, click Column under Percentages:
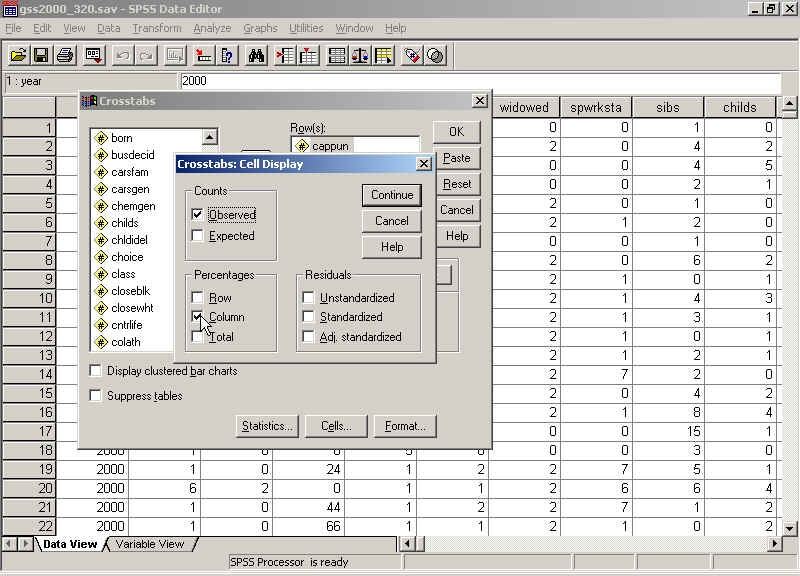
Then click Continue:
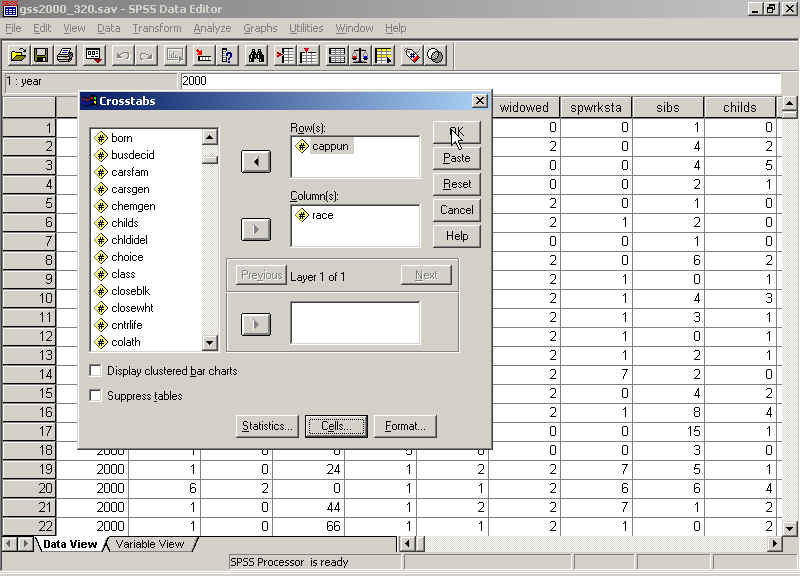
And back in the Crosstabs dialog box, click OK:
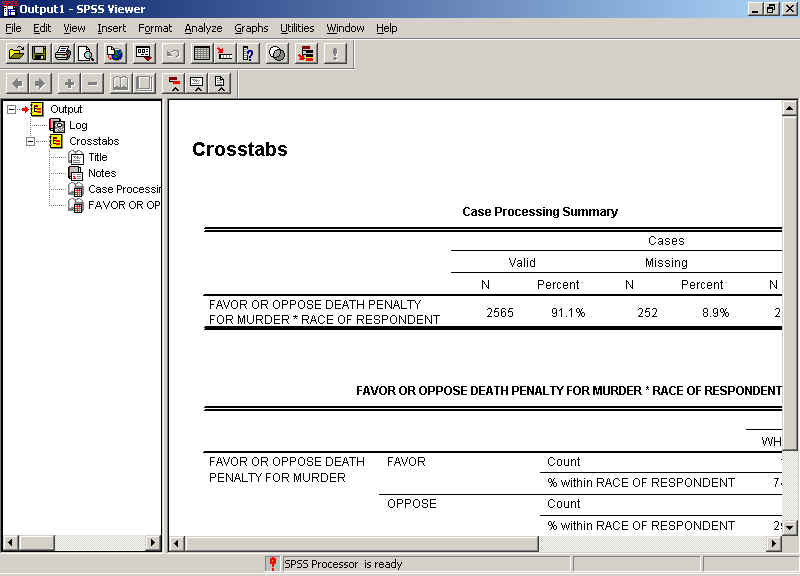
Your table will run and be displayed in the Output window. You can move around the Output window using the scroll bar to the right and the Outline pane to the left.
If the exercise calls for obtaining gamma, tau, and/or chi-square, you will need to click Statistics in the Crosstabs dialog box:
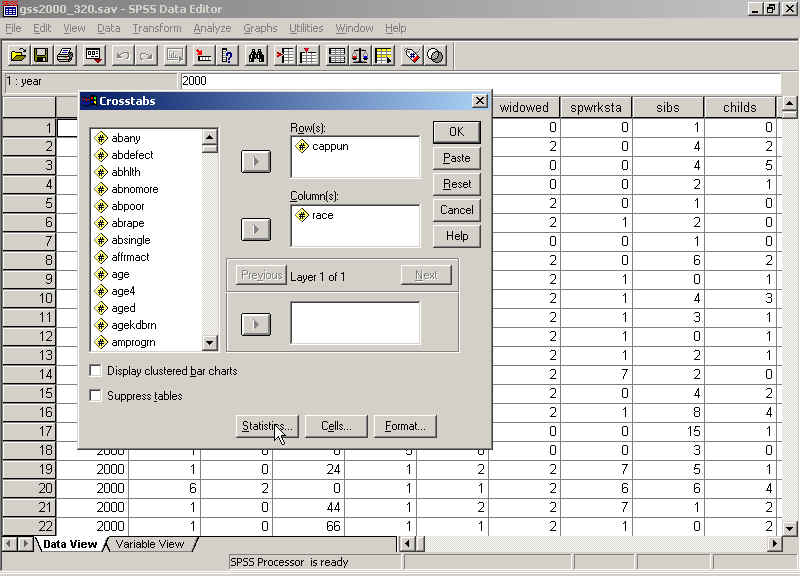
In the Statistics dialog box, click Gamma, Lambda (for tau), and/or Chi-square as necessary, then Continue and Okay. Remember that you will still have to obtain column percentages in addition to gamma, tau, and/or chi-square.
Gamma:
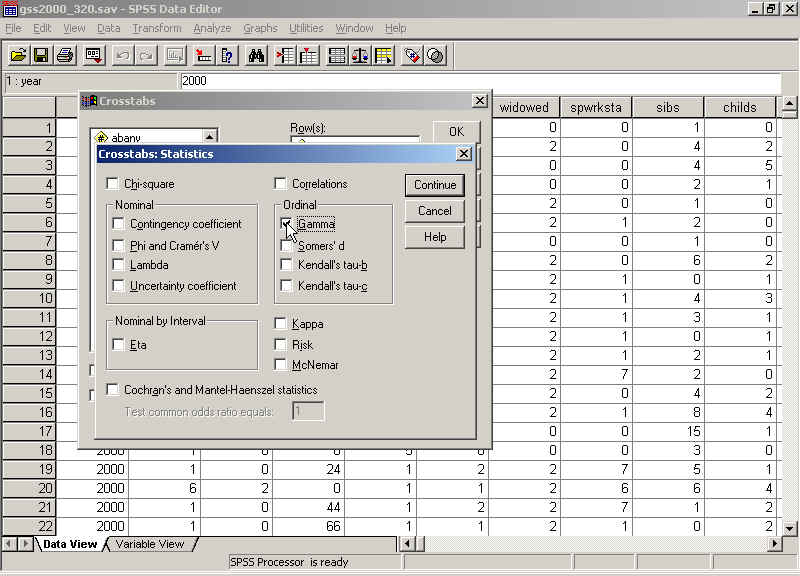
The gamma results are displayed in a table called "Symmetric Measures" (below). The value you want to look at is in the row labeled "Gamma" and the column labeled "Value":

The gamma value is .491 for the relationship between race and attitude toward capital punishment. This is pretty strong, as bivariate relationships go; recall that strength is evaluated by examining the absolute value of gamma (with no sign). A gamma value of 0 would indicate no relationship and a value of 1 would indicate a perfect relationship. If there's no sign indicated for gamma, it's positive (indicating a direct relationship). Here's an example of a negative gamma (indicating an inverse relationship):

This gamma is weaker than the previous table, not because it's negative, but because .229 is closer to 0 than .491. See also the Ch. 14 Supplemental Presentation.
Tau:

The results for Goodman and Kruskal's tau are contained in a table labeled "Directional Measures." You'll find the value of tau in the row labeled "Goodman and Kruskal tau" under the appropriate dependent variable. In this case, that's "VOTE FOR CLINTON, DOLE, PEROT Dependent." The value of tau is in the column labeled "Value" (.366). Recall from the Ch. 14 Supplemental Presentation that tau is always positive, never negative, since at least one of the variables is nominal level, so its attributes cannot be said to have "low to high" or "high to low" ranking. Strength is evaluated as distance from 0 (no relationship) and 1 (perfect relationship).
Chi-square:
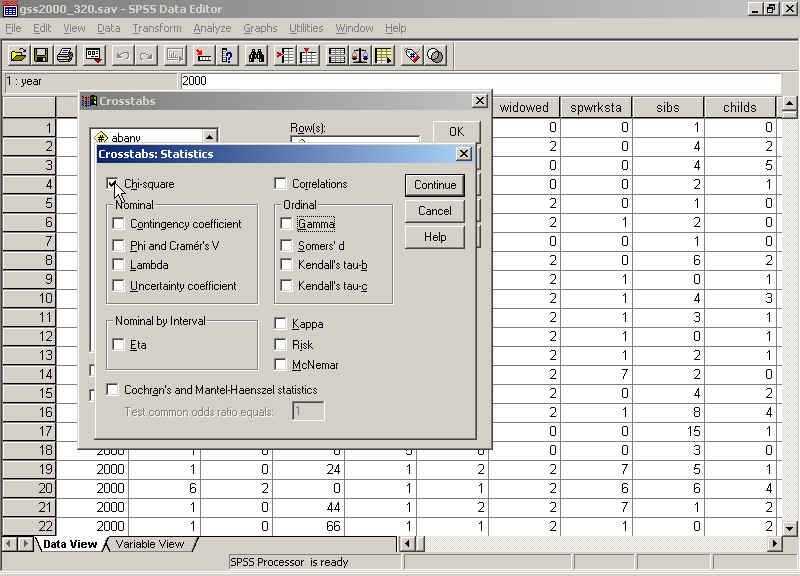
The chi-square table is labeled "Chi-Square Tests" in the output window. In order to determine if you might find a relationship as strong as the one you have in your sample when the two variables are in fact NOT related in the population (null hypothesis), you need to look in the row called "Pearson Chi-Square" at the number in the column called "Asymp. Sig. (2-sided)." If this number is less than or equal to .05, you can reject the null hypothesis and say that there's a 5% chance or less (< or = .05) that you would find a relationship as strong as the one you have in your sample when the two variables are in fact not related in the population. The relationship is said to be "statistically significant" (see also Ch. 14 Supplemental Presentation). Here's the chi-square outcome for the relationship between race and attitude toward capital punishment.

When SPSS gives you a signficance level for chi-square that is ".000," (above) you can reject the null hypothesis, since .000 is less than .05. (Note: .000 really means less than .0005). Here's an example in which you cannot reject the null hypothesis (relationship between abany and race), since the significance level of chi-square is not < or = .05.
