Development and Demonstration for National Fuel Efficiency
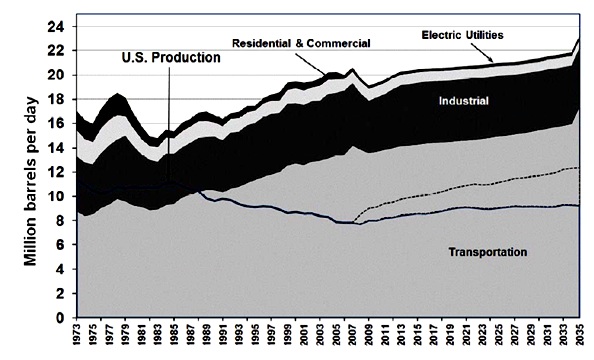
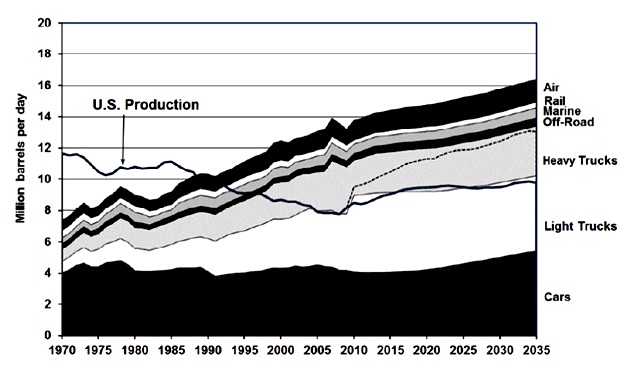
According to the Transportation Energy Data Book the U.S. petroleum production accounts for 9% of world petroleum production, while the U.S. consumes up to 22.5% of world production. The U.S. transportation sector on its own consumes 69.7% of the total petroleum used in the U.S., which adds to 172.5% of the available U.S. production. The last year when U.S. petroleum production was able to supply all the petroleum required by U.S. transportation was in 1989. This high dependency on petroleum of the U.S. can be primarily attributed to U.S. being one of the most motorized conturies in the world with 19.4% (132 million) of world car registrations and 40.8% (116 million) of trucks and bus registrations.The recent advances in intelligent sensing and communications of transportation systems opened the door for many novel ways of achieving improved fuel economy of road vehicles. The current industry approach to improve fuel efficiency focuses on: vehicle design or engine/transmission functioning, instantaneous miles per gallon (mpg) and miles remaining to travel. One of the novel method of improving fuel economy of vehicle fleet is via learning fuel-efficiency driving behavior. Vehicle fleets composed of large number of heavy vehicles frequently perform runs with different drivers over a set of fixed routes (e.g. transportation of employees to work using a park-and-ride bus system). While most drivers typically achieve on-time and safe driving performance their actual driving behaviors (e.g. acceleration profiles) and the subsequent fuel economy might vary substantially. Our proposed Intelligent Driver System (IDS) combines vehicle performance data with GPS information to incrementally build a model of historically most fuel efficient driving behavior for a set of fixed routes. |
 |
 |
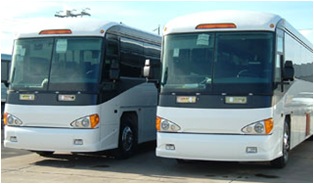
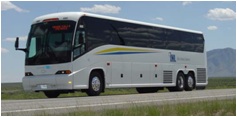
The Idaho National Laboratory Integrated Transportation Services Bus Fleet constitutes an ideal experimental test-bed for developing the concept of improved vehicle fleet fuel efficiency. The INL bus fleets has over 60 years of experience providing transportation service to INL employees in South-Eastern Idaho. The fleet comprises of over 100 busses and around 100 drivers who transport almost 3,000 passangers daily and achieve 2 million miles annually. Most of the buses are equiped with industry standard CANbus interface for vehicle monitoring and diagnostics. As part of this research effort a hardware/software interface is being developed for acquiring the data from vehicle sensors and combining it with GPS information for vehicle locazation. |
 |
 |
|
INTELLIGENT DRIVER SYSTEM
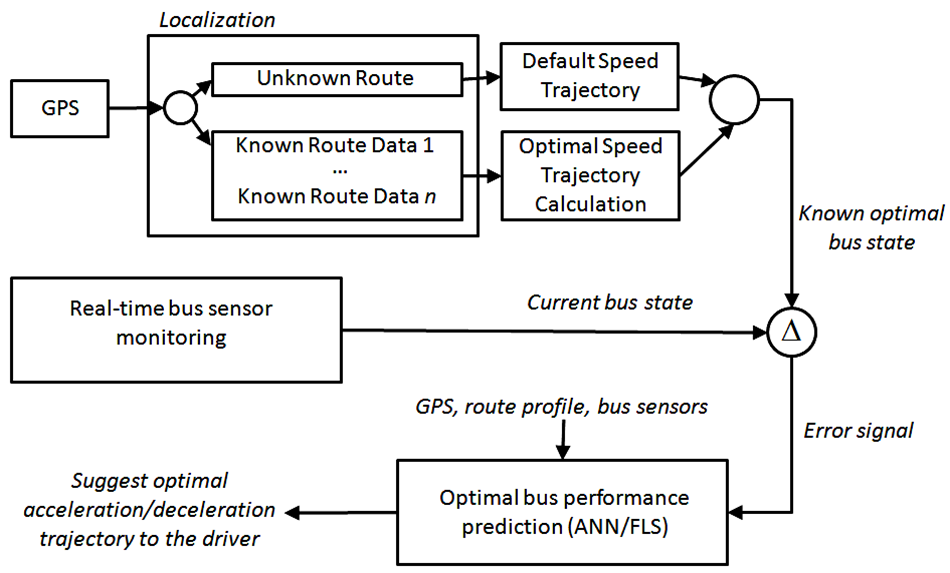
The fundamental idea of the proposed Intelligent Driver System (IDS) is to collect historical performance data from a pool on identical routes, learn from this data the historically optimal driving policy and then inform individual drivers about the optimal driving behavior during future runs. The overall architecture of the proposed IDS is shown below. The two inputs into the system are the vehicle position information from the GPS receiver and the real-time vehicle performance data obtained from the vehicle's system diagnostic port. The procedure is composed of four main steps as follows: 1) vehicle localization, 2) optimum velocity calculation, 3) comparison of the calculated optimum and the current vehicle state, and 4) optimum control policy calculation. The vehicle localization is performed by the localization module. The module must determine whether the vehicle is located on a previously visited route. In case of an unknown route, the localization module cannot provide any historical data. For a previously visited route, a set of n recorded data sets on that particular route can be retrieved from the database. In the optimum velocity calculation step, the IDS computes the historically optimal velocity with respect to fuel economy and to the provided driving constraints (e.g. min/max allowed vehicle speed). For a previously unknown route, the algorithm simply outputs a default (e.g. constant) desired velocity. Hence, for an unknown route, the entire system degrades into a classical cruise control. The calculated historically optimal vehicle velocity is then compared to the current vehicle velocity.The difference is then supplied to a fuzzy logic Proportional-Derivative (PD) controller. The fuzzy logic controller outputs a suggested change in the control signal (i.e. gas pedal position), which should be applied in order to maintain the historically optimal velocity.
|
 |
 |
 |
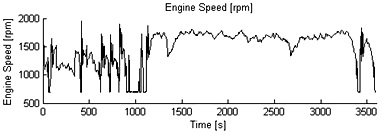
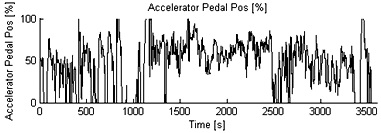
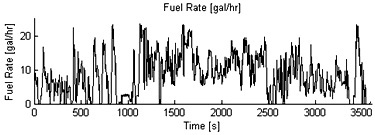
| Examples of the data attributes logged from the vehicle diagnostic systems are: vehicle speed, engine speed, fuel rate, engine output torque, engine load, gas pedal position, cruise mode or cruise speed. Below are examples of the logged data over a 50 miles run from Idaho Falls to the INL site. |
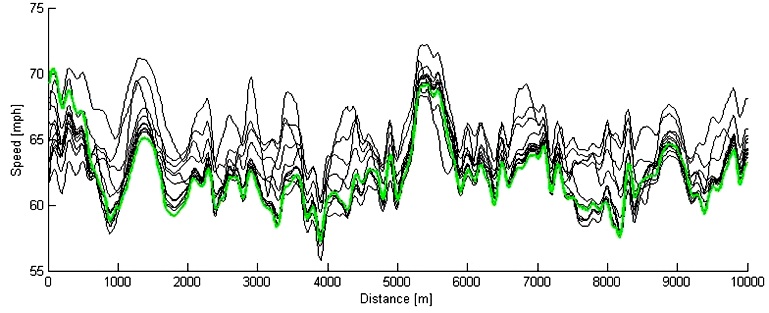
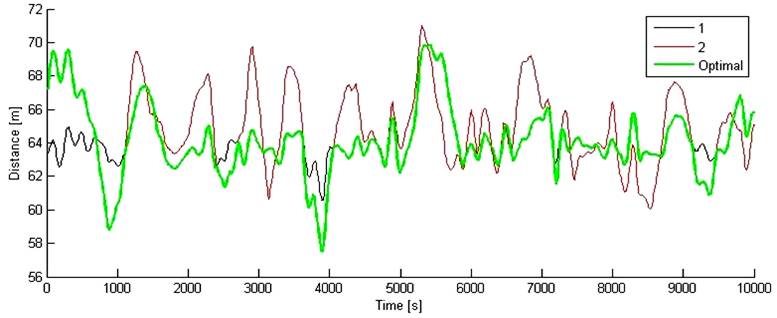
Our research projects focuses on development of Intelligent Driver System (IDS) component, which has the capability to learn, adapt to and optimize the drivers' performance, The user interface then uses the computed information to guide the drivers towards improved fuel efficiency. One of the main ideas utilized by the IDS component is that different fleet drivers perform runs on identical road segments under different conditions. Hence, the IDS algorithm incrementally learns the model of the most fuel efficient driving behavior on a specific route. The algorithm uses the GPS data to synchronize different data streams. A heuristic approach is used to segment the route into intervals based on driver's behavior. This segmenting technique is used to extract specific driving behaviors in different situations from the different drivers. The figure below shows the calculated optimal driving velocity (green) based on multiple historical runs. |
DRIVER PROMPTING
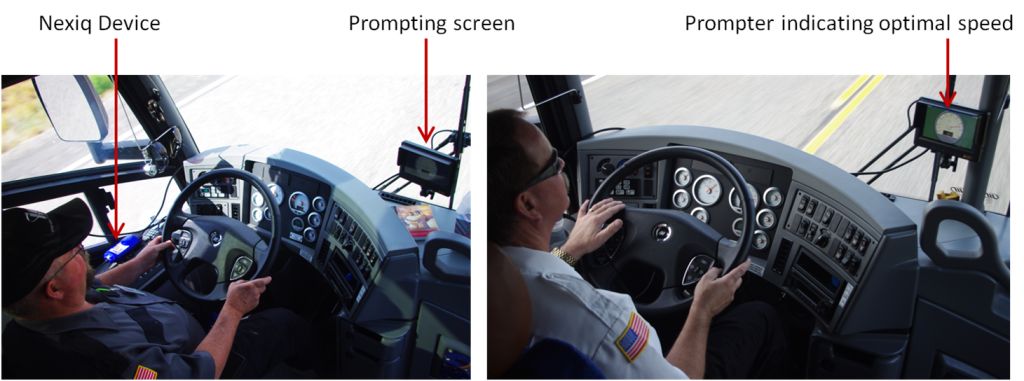
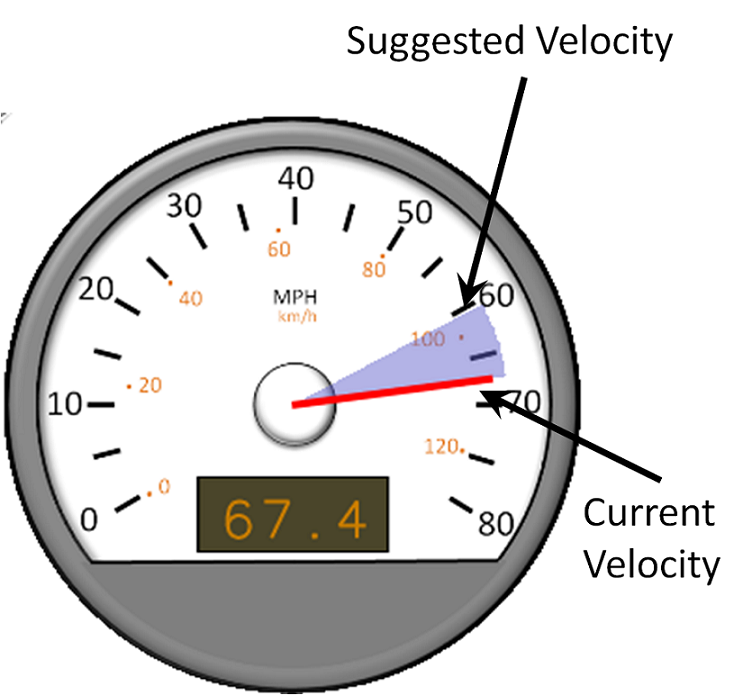
Once the optimal fuel efficient behhavior is identified, it needs to the communicated with the driver. This has to be done while the vehicle is being driven. Therefore, the information presntation has to be unobstructive and intuitive. A low cost, unobstructive and intuitive visualization framework was developed to this end.
|
VirtualBus Simulator
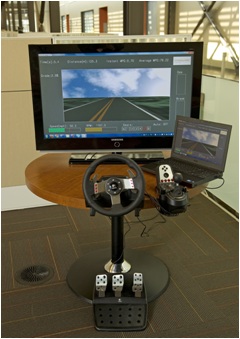
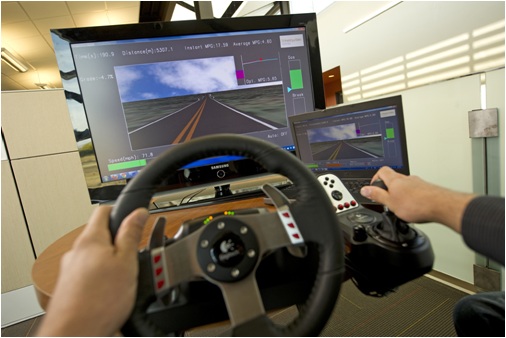
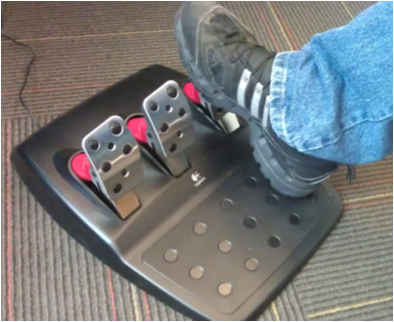
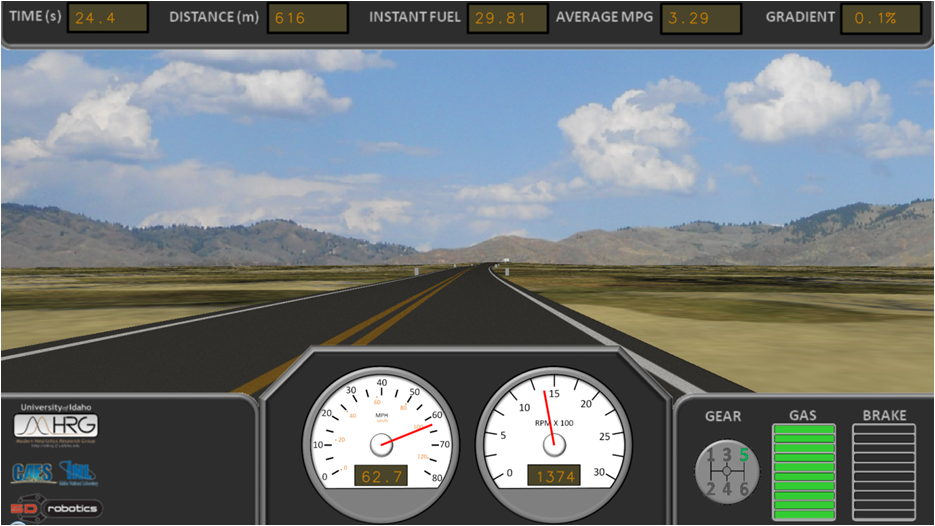
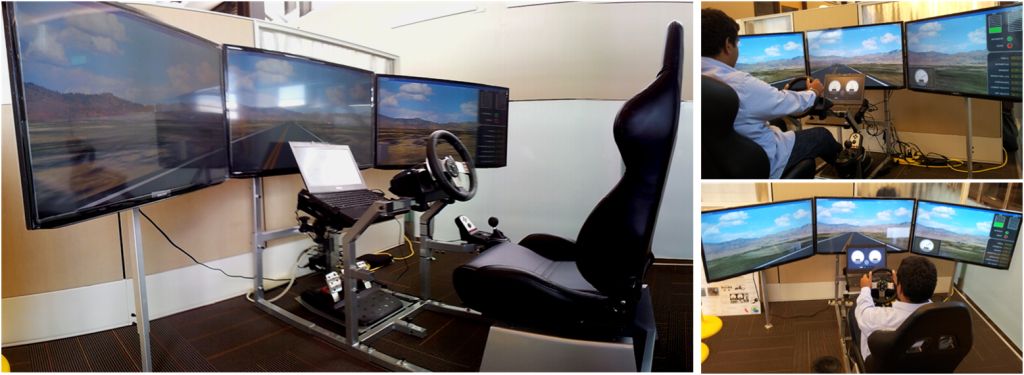
To facilitate the initial development of the Intelligent Driver System a bus driving simulator, called the Virtual Bus, has been developed for simulated data acquisition and algorithm prototyping / evaluation. The Virtual Bus is an interactive driving simulator implemented using C++ and OpenGL. It models the longitudinal dynamics of MCI D-Series D4504 bus. The bus model is placed in a virtual environment with simulated gravitational force, rolling resistance force, aerodynamic drag force, engine and braking force. The application supports randomly generated road profiles as well as replay of real-world GPS road data. To further enhance the driving experience the Virtual Bus application has been coupled with a driving simulator HMI, which provides realistic analog control including force-feedback sensation. |
Real Bus Data Acquisition
| With real world data acquisition, bus diagnostic data are collected by CANbus. The tools for interfacing with CANbus and decoding J1939 protocol are shown below. The CANbus integrate the collected bus data with GPS information and then relay the real-time streaming of bus diagnostics into the intelligent driver system. |
|


