- Why do a first pass image?
- Adds additional information.
- Analyze RV wall motion and calculate ejection fraction.
- Comments/concerns:
- Most manufacturers of gamma cameras today claim first pass capability.
- Concerns regarding this statement
- A single large crystal:
- Reaches count saturation at 150k cps or less.
- Lack of counts results in a low count rate image.
- Multi-crystal system:
- Can attain up to 1,000k cps.
- Contains enough counts for first pass analysis.
- System has limited resolution.
- Scinticor (a multi-crystal imaging system)
- Multiple crystal concept:
- Size of the crystal area is 8" x 8" x 1".
- The crystal is "etched" into many small squares.
- There are 400 etched squares cm = multi-crystal format.
- Thin "pen" shaped PM tubes are attached to the multiple crystals which collect the scintillation.
- This increases the camera's ability to collect more counts than a single crystal system, but this does have resolution limits.
- Reason for limited resolution relates to the amount of crystals in the imaging system (much like setting your matrix on a regular imaging system except the crystals set it. Therefore, there is a limit to matrix/resolution).
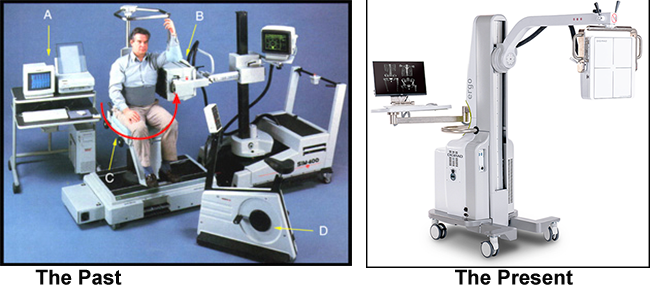
- Refer to the image above to identify the other parts of the Scinticor and Digirad systmes are displayed:
- A - Processing station
- B - Detector head
- C - Rotating chair
- D - Ergometer
- Stressing the patient
- The patient is stressed on the ergometer instead of a treadmill
- At peak exercise the radio-bolus is injected
- First pass images are collected
- If only first pass data is required (no SPECT imaging)
- Position the heart in the ANT projection
- 20 mCi Tc99mDTPA is injected as an IV bolus
- Volume < 1.0 ml and as little as 0.1 ml
- Bolus volume must be small and compact. (What would happen if a large volume bolus was injected?)
- Acquisition set at 20 to 25 msec per frame for 30 to 60 seconds.
- Sometimes a button source is used and placed above the heart in order for the computer to correct for motion (see processing for more details).
- Stress and rest images can be acquired.
- Tc99mDTPA will be eliminated quickly through the kidneys, which allows for repeated injections.
- If first pass and SPECT data are required
- From the above, instead of using Tc99mDPTA, a Tc99m-myocardial perfusion agent is used.
- First pass is acquired, as indicated in the above section.
- Following the first pass technique, SPECT imaging can be attained at 30 to 60 minutes post injection.
- Data is collected while the patient sits in the chair (see above image).
- Instead of the detector moving, the chair rotates 180 degrees (note red arrow) and the camera collects the SPECT data.
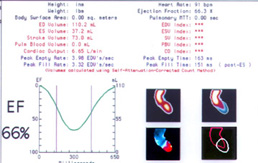
- Processing (images processed shows the LV. It should be noted that the RV is processed in the same manner)
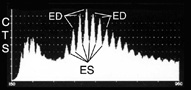
- When the raw data is put on display and end-diastolic image is selected and an ROI is drawn around it
- The following histogram is then generated which shows the bolus of activity moving through the LV.
- Computer selects ED (peaks) and ES (valleys)
- Computer then selected those ED and ES frames and generates a cine by adding up the counts in all of the selected frames
- Operator has the choice of changing ED/ES points on the curve, should the wrong peaks/valleys be selected by the computer
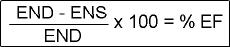
- Ejection fraction is then calculated given the formula
- Composite ED/ES is then displayed with phase and amplitude data (image not available)
- Phase is the uniformity of contraction displayed in color
- Amplitude is the strength of contraction displayed in color
- Finding the exact area of the LV for EF calculation (not all these images are available)
- From the ROI drawn above, background is reduced on the ED image to the point where the valve plane is noted. This is indicated by a decrease of activity between the ED and ES. (Why would there be decreased activity at the valve plane?)
- An ROI re-drawn from the point of the valve plane to the apex of the ED
- EF is recalculated
- EF map of the LV is then displayed showing regional wall motion
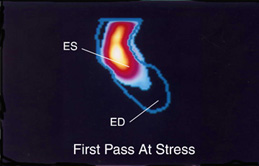
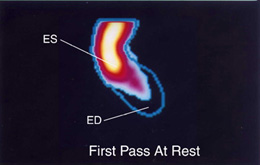
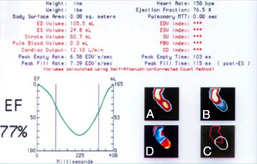
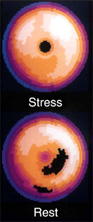
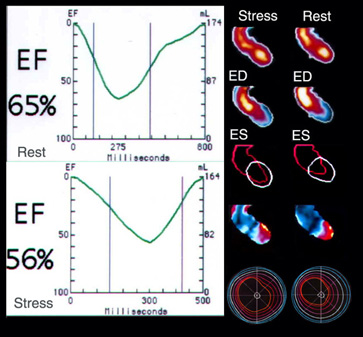
- Display of a normal Stress and Rest First Pass data
- First row of images shows the LV at ES with the ROI drawn down to the apex (the extended ROI outlines the ED)
- Second row
- A - Indicates where the valve plane is located; note the area of reduced activity and is the ED image
- B - Indicates ES
- C - The red shows the left side of the heart with ROI drawn around the area be used to calculate the EF
- D - Amplitude image: red area shows significant movement of the LV while blue shows little to no movement
- Also note that ejection fraction curves are drawn for both stress and rest images
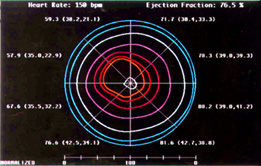
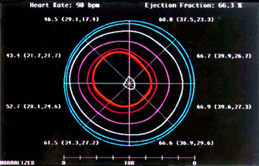
- Third row displays maps of the LV indicating myocardial movement
- LV is divided into 8 segments and each segment shows individual ejection fractions
- Contour lines are also dawn from the center and move outward, which indicates the amount of wall motion
- The further the lines are apart, the greater the movement
- The closer the lines are to each other indicates less movement
- Space and distance between all contour lines indicates movement
- In the center of each map is the ROI of the LV at ED
- Images can also be displayed in a cine format. (below)
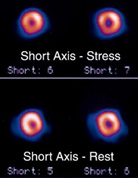
- Tomographic images can be generated if Sestamibi or Tetrofosmin is administered.(see below)
- From the first pass images above several short axis images are on display.
- From a resolution standpoint, what do you think of these images, when compared to images from a single crystal system?
- Bullseye maps are determined from the SPECT data (above)
- Stress shows apical thinning (normal).
- Rest shows some reverse redistribution, which is considered to be an artifact.
- Abnormal first pass is also available. What makes this first pass data abnormal? (Comment on: Wall motion, ROI placement, amplitude image, % EF, and EF curve).
- How do you correct for motion in a first pass stress study?
- As indicated earlier a button (point source) can be attached to the patient in which the computer will correct for motion by keeping the point source in same X/Y plane.
- If a point source is not used, the computer can also correct for motion by applying the same technique to the LV.
- Yet another application of first pass: Looking for a Shunt
- Definition of a shunt in the heart.
- There is a hole in the septal wall.
- Right-to-left shunt means that blood is flowing from the right ventricle to the left ventricle, through the "hole" (shunt), instead of first going though the pulmonary artery and vein.
- Left-to-right shunt means that some of the patient's blood from the left ventricle returns to the right ventricle, via a shunt, instead of all the blood going out the aorta.
- Using a single crystal gamma camera a 20 mCi bolus of Tc99mDTPA is injected with the heart imaged in an anterior projection.
- Set acquisition parameters at:
- 0.2 second per frame
- 64 by 64 matrix
- LEGAP or LEHS collimator
- 30 to 60 seconds of acquisition
- Images are displayed and ROIs drawn over the RV and LV.
- Computer generates time activity curves.
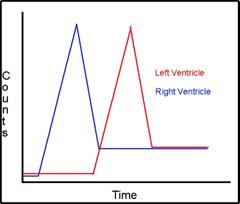
- First set of curves show what normal distribution would be between the right and the left ventricle. (Identify how the bolus travels through the heart and compare it to the normal time activity).
- The second set of curves is an example of right-to-left shunt. Notice how the activity from the right ventricle enters the left ventricle before it is supposed to.
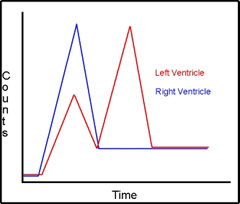
- Third set of curves is an example of left-to-right shunt. Notice the activity from the left ventricle re-enters the right ventricle, which indicates abnormal flow of the radiopharmaceutical.
- From the two types of shunts identified, which one would not require a computer for analysis? Would it be a R to L or a L to R shunt? The key here is the radiopharmaceutical.
Click here for the procedure on Cardiac First Pass
Return to the beginning of the document
Return to the Table of Contents
4/22
