PET and Imaging the Heart
- Types of tracers and their behavior in cardiac imaging
- 15O water
- T1/2 = 2 minutes
- Used to analyze brain and heart
- In-house cyclotron required
- H215O and/or C15O are used
- Freely crosses the cellular membranes perfusing into cardiac tissue
- Equilibrates quickly at ~100% extraction (why is the EF so high?)
- Allows for the calculation of myocardial blood flow, however, a disadvantage to this technique is that there is a high level of background within the blood pool (LV chamber) and surround tissues.
- 15O does perfuse into myocardial tissue, but a significant portion remains in the blood pool
- It has a very short half-life
- C15O is used to correct for these background levels
- Two sets of images are taken 15O water defining myocardial walls and blood pool
- C15O defining the blood pool
- Subtract b into a = shows myocardial walls
- 13NH3
- T1/2 - 10 minutes
- Primarily used to image the myocardium
- Has been shown to have some utilization in brain imaging
- It's short T1/2 requires the use of an in-house cyclotron
- Clears quickly from the blood pool and perfuses into myocardial tissue via the glutamic acid pathway
- Converts to NH4+ within the cardiac tissue (ammonia [NH3] prefers a pH of below 7.0 whereas ammonium [NH4] prefers a pH of greater than 7.0)
- Is similar to uptake when compared to FDG, however, the biopathways are different
- Consider to be mostly a myocardial perfusion agent
- Advantage - Ammonia does not require patient fasting
- Disadvantage? Demonstrates significant liver uptake
- Stress testing is accomplished with the use of a vasodilator
- 13NH3 should be used as a perfusion agent while FDG should be used a a viability agent.
- 82Sr/82Rb generator (1)
- Properties
- Parent - 82Sr has a 25.6 day T1 /2
- Daughter - 82RbCl has a 76 second T1/2
- 0.2μCi/mCi breakthrough limit which is checked daily, prior to patient use.
- Bracco suggests that breakthrough may need to be done twice daily https://www.aapm.org/government_affairs/documents/July_13_Bracco_Customer_Letter.pdf
- Is administered through an infusion system
- Extraction fraction = 50-60% (however, this value is difficult to assess)
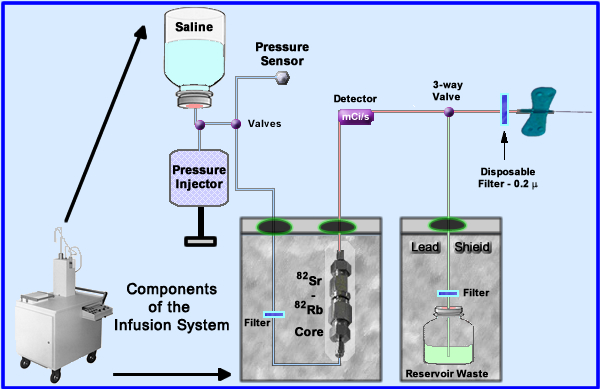
- The generator is placed into an infusion system for patient administration. The essential components to this system are noted
- Saline (upper left) enters the system with the assistance of a pressure injector that is controlled by the technologist
- Saline is sent through the radioactive core and then out to the patient
- Several filters are used to reduce the possibility of injecting particulate matter
- Some specifics regarding the elution and its delivery - Follow the flow of saline: blue = saline to red = picks up the radio-tracer, and green = discarded eluate that doesn't go to the patient
- The amount of mL flow is regulated by a pressure injector
- Saline is sent to the 82Sr/82Rb core where 82Sr is extracted at a specific flow rate (should not exceed 50 mL/minute)
- Radioactive saline is monitored and measured within the delivery system
- The 3-way valve (also referred to as a divergence or solenoid valve) diverts activity either to the patient or the waste reservoir
- Calibration is done at the beginning of ever day where the first elution is collected and measured, but not injected into the patient. In addition, breakthrough of 82Sr and 88Sr are analyzed (the procedure is described below)
- After each elution it acquired it takes 10 minutes for the generator to build up the next dose of 82Rb
- 82Sr - has a T1/2 of 25.5 days and 82Rb T1/2 is 75 seconds
- 82Rb is a K analog and becomes incorporated into the sodium-potassium pump
- Package insert is available for your review
- Dose criteria
- Adult single dose = 40 mCi (30 - 60mCi)
- Target organ is the kidneys
- Maximum dose: single total = 60mCi or 120 mCi for rest and stress
- Maximum flow rate is 50 mL/min
- Volume per dose not to exceed 100mL (single), or 200 mL total
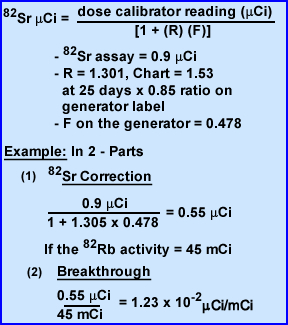
- Calculate of 82Sr breakthrough
- Relate this procedure to 99Mo breakthrough.
- First thing in the morning, prior to patient use, 50 mL is elution and discarded
- After 10 minutes a second elution of 50 mL is collected over one minute in a glass elution vial (do not use plastic)
- Note - the generator always requires at least 10 minutes to regenerate
- Measure 82Rb on its own window setting noting the time between measuring the activity and the time that the elution was started, so you can decay back to time zero
- Or 82Rb can be measured by setting the dose calibrator reading to 60Co window and dividing the measured activity by 0.548 (decay back to zero time)
- Time zero is the exact time when the elution is finished
- Once the 82Rb measurement is done let the vial decay to background. This takes 1 hour. Now the only activity remaining is 85Sr/82S
- Now determine the amount of Sr breakthrough
- Now measure the amount of 82Sr with the dose calibrator
- Since 85Sr builds up over time and interferes with 82Sr active the ratio must be looked up in the package insert. See Ratio Chart
- Finally the ratio value found in generator's calibration must be identified and recorded
- Now apply those three values to the formula
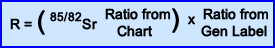
- The forth value that has to be included is the Factor (F) which is always 0.478, considered a factor required for 85Sr, and is used in the breakthrough calculation
- Now that you know these values we are ready to calculate a breakthrough problem!
- Assume the dose Calibrator reading for 82Sr was 0.9μCi. This dose needs to be corrected
- Calculation of R
- If generator calibration was 25 ago the ratio from chart is 1.53
- Assume the generator's label had a value of 0.85
- Therefore the R value = 1.301
- Determine the correction of 82Sr
- In the denominator calculate 1 + [F-(0.478) x R-(1.301)]
- In the numerator use the dose calibrator reading recored at 1 hour post elution = 0.9μCi
- Corrected activity for 82Sr is 0.55 μCi
- Now you are ready to apply theμCi/mCi values and determine breakthrough.
- Numerator gets the corrected Sr activity 0.55μCi
- Denominator has a reading of 45 mCi
- And your answer is 1.23 x 10⁻² μCi/mCi
- Breakthrough must be 82Sr <0.2μCi/mCi
Data on 82Sr - http://www.nucleide.org/DDEP_WG/Nuclides/Sr-82_tables.pdf
Data on 85Sr - http://www.nucleide.org/DDEP_WG/Nuclides/Sr-85_tables.pdf
Application of myocardial viability with the use of 18FDG
- Two states of metabolism occur with the myocardium: fatty acid and glucose or oxidative and metabolic
- The heart prefers fatty acids for its energy source and when the patient's has been fasting, blood sugar levels are low and fatty acid is the energy of choice
- During a FDG PET exam approximately 80% of patients will have reduced myocardium uptake with FDG
- However, in the case of where there is high levels of sugar in the blood (example - the patient just ate) the heart switches to a glucose metabolism for its source of energy. If FDG is injected during this metabolic state there should be a significant increase in myocardial uptake
- Assessing the heart for cardiac viability with the utilization of FDG (3)
- Patient should be NPO for at least 4 hours prior to a Glucose Loading procedure
- Administer between 25 - 100 g of glucose, PO
- Once glucose is ingested it will causes the glucose level to increase in the blood stream, which normally continues to elevate for at least an hour
- At one hour post dose glucose level should be taken and then every 15 minutes, to identify the point in which the glucose level begins to drop
- Once a decrease is noted, the patient is then injected with FDG. Why should FDG be injected at this point in time?
- Image the patient 45 - 60 minutes post FDG administration
- Optimal FDG uptake occurs where the glucose level is between 100 - 140 mg/dL
- Alteration in this procedure if the patient is a diabetic - glucose is given PO if the level is below 200 mg/dL
- After glucose ingestion, wait 45 - 60 minutes and measure the sugar level. If the level is:
- 110 - 130 mg/dL then inject FDG (insulin not required)
- 130 - 140 mg/dL = 1 u insulin
- 140 - 160 mg/dL = 2 u insulin
- 160 - 180 mg/dL = 3 u insulin
- 180 - 200 mg/dL = 5 u insulin
- > 200 mg/dL physician dependent
- After insulin administration wait 30 minutes and if the blood glucose has dropped to 100 - 140 mg/dL then FDG can be injected
- Glucose-clamping procedure (3)
- Special comment - Several articles discuss this procedure where mg/dL is replaced my mM (moles). To me the change to moles for the reading of blood glucose (BG) is confusing and causes a problem with how much insulin to administer, however, I've discovered an article by ASNC that outlines a modification to this approach and is a procedure employed at Emory University
- A fasting patient's BG is measured
- If the BG is <125 mg/dL 50% dextrose in water (D-50-W) with 25g of glucose, and 20 mg of hydrocortisone (reduces discomfort when dextrose IV is given)
- If the BG is between 125 - 225 mg/dL D-50-W is given with 13 g of glucose
- If the BG is >225 mg/dL then unit(s) of insulin is/are given via the formula (BG - 50)/25. As an example if the BG was 250 then 8U if insulin is administer
- At 30 to 60 minutes post glucose or insulin administration FDG is injected in the if the BG is <150 mg/dL.
- If not, re-apply the formula above, administer additional unit(s) of insulin, and recheck the BG in 30 minutes
- FDG can be given when the BG level drops to 150 mg/dL or below
- If the BG is between 150 to 200 mg/dL cardiac uptake will be of poor quality
- When is FDG used in myocardium viability?
- Usually questionable viability is first noted in a technetium MPI study via the lack of uptake in the myocardial wall
- 201Tl or FDG may be used at this point to determine to determine if there is any viable cardiac tissue
- Uptake of FDG in the areas of question means that there if there are viable cells make the patient a candidate for re-vascularization
- Note - upregulation occurs with glucose when heart tissue is in an ischemic or in an anaerobic state that causes an increase in glycolysis by the myocardial cells. So as long as there is some blood flow FDG be absorbed
- Lack of FDG uptake means infarct/necrosis and requires no intervention
- Biodistribuiton of FDG (glucose loading) in the myocardium occurs as following
- 0 - 20 minutes FDG activity is seen mostly in the blood pool or left ventricle
- 20 - 30 minutes activity begins to perfuse into the myocardial tissue, causing a reduction of activity in the vascular pool
- 30 - 40 minutes and beyond FDG is seen mostly within the LV walls with slightly less activity at the apex. The reduced apical activity is referred to as apical dip which may be related to increase cardiac contraction and/or a partial-volume effect
- Right ventricle should not be seen, however, if it has hypertrophy, uptake may be seen as it related to pressure overload, caused by congenital or pulmonary hypertension
- 82Rubdium
- Has a high extraction fraction and relates and is an analog to potassium
- There are two "issues" with this cardiac agent
- Because of its 75 seconds half-life constant infusion is this tracer is required. This causes significant background in the vascular blood when imaging the LV. Therefore background subtraction is required in order to better visualize the walls of the left ventricle
- Of all the positron agents 82Rb is the most energetic with an Emax of 3.56 MeV. It is important to realize that these positrons must first travel through issue before they annihilates. The greater its energy the farther it will travel, resulting in reduced spatial resolution. Refer to the chart below for a comparison of the different positrons we use in nuclear medicine(1)
| Positron |
Emax (MeV) |
E1/3 (MeV) |
Max Travel (mm) |
Mean Travel (mm) |
| 18F |
0.633 |
0.2498 |
2.74 |
0.6 |
| 13N |
1.1985 |
0.492 |
5.1 |
1.5 |
| 15O |
1.732 |
0.735 |
7.3 |
2.5 |
| 82Rb |
3.56 |
1.524 |
14.1 |
5.9 |
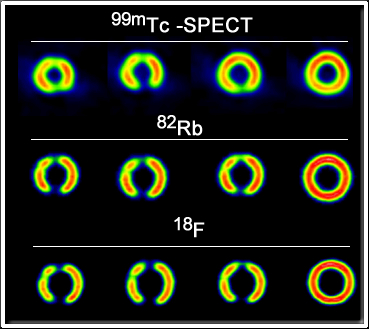
Comparison of 18F SPECT With PET in Myocardial Imaging : Methods
- The above images show slight changes in spatial resolution when compared to 99mTc, 82Rb and 18F. These images were obtained with a phantom and the positrons where attenuation in water (4)
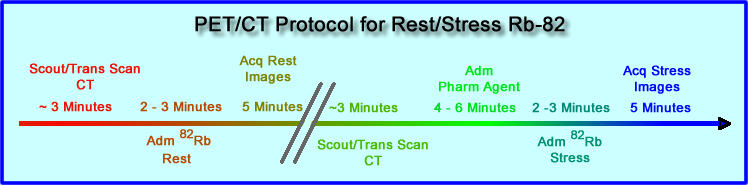
- Time line is noted for the Rest/Stress procedure
- How would this time line change if lexascan was injected?
- Identifying Coronary Artery Disease (CAD)
- PET can be used to evaluate
- Any patient suspected of having CAD, even when the patient has 3 -vessel disease
- The level and area of stenosis can be determined allowing for re-vascularization of the area
- Assessment of initial treatment for heart disease or monitoring of the current treatment technique
- Follow-up surgery
- Assessment of of collateral circulation
- Radiopharmaceuticals routinely in the stress arena include
- 13NH3 and 82Rb are usually the agents of choice, with 82Rb being more assessable because of its availability in generator format
- Stress and rest procedures are compared to determine tracer distribution, just like a routine MPI study
- Stress procedures are pharmacologically induced with either: persantine, adenosine, or dobutamine
- Due to these tracers short T1/2 pharmacological drug must be infused during imaging
- While bicycle exercise has been accomplished while scanning and apparently accurate in diagnosing disease, its seems somewhat cumbersome
- Diagnostic accuracy - SPECT vs. PET
- American college of Cardiology/American Heart Association/SNM concluded
- PET - 87 to 97% sensitive and 78 to 100% specific
- SPECT was 89% sensitive and 78% specific
- More data needs to be collected to further evaluate SPECT and PET
Return to the Table of Content
4/18
(1) Radiopharmaceuticals in Nuclear Pharmacy and Nuclear Medicine (2nd), RJ Kowalsky and SW Falen. Diagram was modified from this book. (p. 356)
(2)Clinical Nuclear Medicine by H-J Biersack and LM Freeman (p. 51)
Source of these lecture material was mostly obtained from: Clinical Molecular Anatomic Imaging by GK. vonSchulthess
(3) Positron emission tomography myocardial perfusion and glucose metabolism imaging
Comparison of 18F SPECT With PET in Myocardial Imaging; Methods - this link will require to you sign up for Medscape, which is a free service.