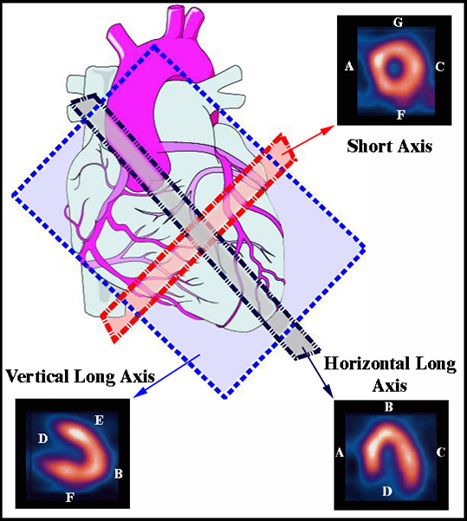
- The images above show the heart as it would "rest" within the thoracic cavity
- Note that the heart is set off to a left angle. This changes the tomographic orientation
- Traditionally, sagittal, coronal, and transverse plains are used, however, since parallel planes can not be drawn through the heart the tomographic orientation must be redefined
- Blue plain = vertical long axis
- Gray plain = horizontal long axis
- Red plain = short axis
- While nuclear cardiology slices are displayed, you can click the image to discover what the plain would look like in an MRI study. This may also help you further understand the anatomical orientation of the myocardium
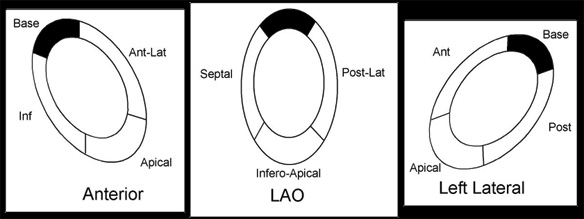
- In addition, the walls of the LV have been identified in the above diagram
 |
A - Septal B - Apex C - Lateral D - Base E - Anterior F - Inferior G - Anterior |
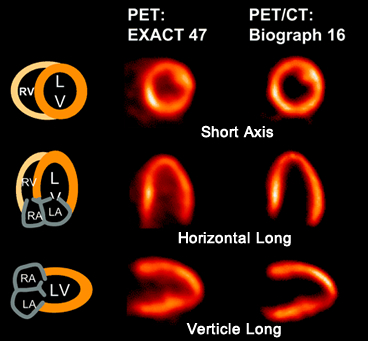
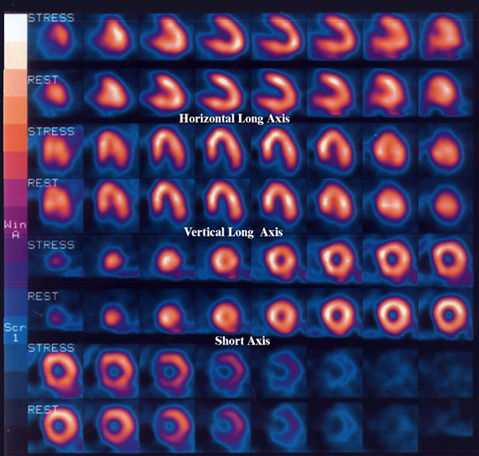
- The above diagram represents the processed data from a Thallium stress test
- Stress and redistribution slices are compared showing the same regions of the myocardial walls: vertical long axis, horizontal long axis, and short axis
- Each stress slice is the same location of the redistribution slice
- If an ischemic area is present, the stress image would show a cold region in one or more areas of the LV, and the redistribution image would show the same area with increased uptake
- If an infarct was present, then both stress and distribution images would show a cold region within one or more of the walls of the LV
- The above example is of a normal Thallium stress procedure with no defects present
 >
>
 |
These images to the left represent the LV walls labeled Short, Vertical Long, and Horizontal Long in a gray scale format instead of color. It should also be noted that different processing programs place or orientate the final processed data at different angles. Compare the colored images (ADAC) to the BW images (Microdelta) |
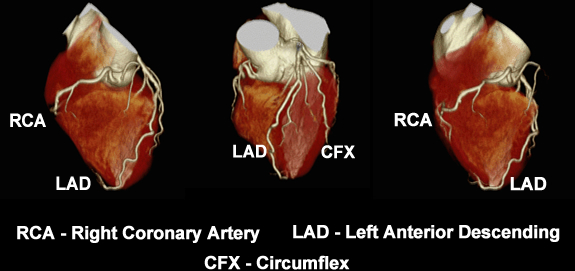
- CT angio displays the three major arteries of the heart
- Animation and labeling are provided