- 99mTcSestamibi or 99mTetrofosmin
- 32 or 64 stops
- 64 or 128 matrices (usually 64)
- ~40 seconds per stop at 64 matrix single detector
- ~20 stops for a dual detectors
- Imaging time should never go over 30 minutes
- Usually, more time is required for the acquisition of the rest images because there is less activity (specifically in the one day protocol)
- Whereas on the stress images, a more significant dose is administered and less time is required to collect the imaging
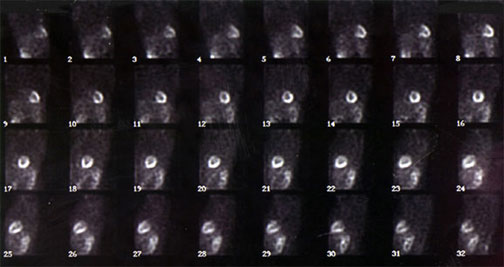
- Images can be displayed as a set of static images or in a "snake" format" allowing the viewer to look at all 32 or 64 images in a static mode
- Images are also evaluated in the dynamic or cine mode. Raw data tells us several key points
- There is a concern with attenuation artifacts that can usually be seen in this mode
- Look for possible movement
- Look for possible activity that may interfere with the scan
- If the LV "jumps" up and/or down, how might this affect our imaging results?
- If there is excessive activity from the liver or small intestine, how might this affect your imaging results?
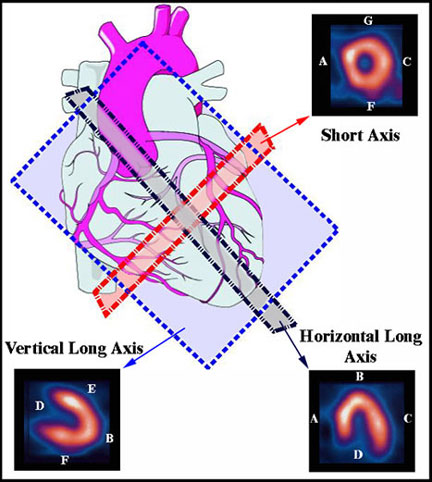 |
A - Septal B - Apex C - Lateral D - Base E - Anterior F - Inferior G - Anterior |
- The image above shows the heart as it would be in "rest"
- Traditionally, sagittal, coronal, and transverse planes are used in SPECT imaging. However, since parallel planes cannot be drawn with the heart (it's at an angle), the tomographic planes are redefined
- Blue plain = vertical long axis
- Gray plain = horizontal long axis
- Red plain = short axis
- Additional analysis of cardiac contraction can be completed on SPECT image as seen above
- Different types of processing from the collected data can also display just a beating left ventricle that was acquired in a gated format producing this dynamic image
http://www.norfolknuclear.com/patients/heart_scan.htm
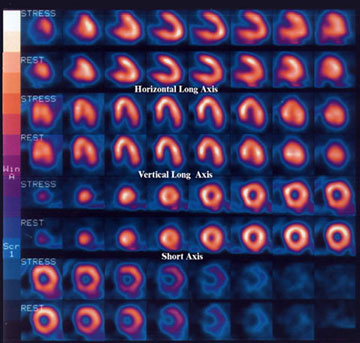
- The above diagram represents the processed data from a Thallium stress test
- Stress and rest (redistribution) slices are compared, showing the same regions of the myocardial walls: vertical long axis, horizontal long axis, and short axis
- Each stress and redistribution slice should indicate the same location of the myocardium
- This allows for direct comparison of the same region in the cardiac tissue. Look for equalization of the radiotracer uptake in both stress and rest images
- If an ischemic area is present, the stress image will show a cold region in that location LV and the rest images will have normal uptake
- If an infarct was present, then both stress and distribution images will show a cold region within one or more of the walls of the LV(cold in stress / hot in rest)
- The above example is of a normal Thallium stress procedure with no defects present
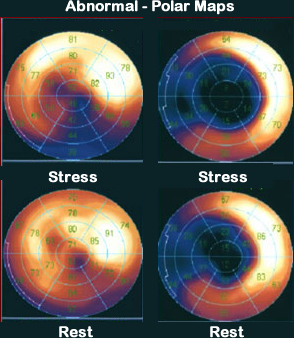
- The above example is called a Bull's Eye or Polar Map
- Processing a Bull's Eye will be discussed in the Spring
- What is a Bull's Eye? Polar map?
- Consider this a myocardial map of the LV
- The center part of the heart is the apex (or tip) of the LV. There are four walls that define the LV (Anterior, Posterior, Inferior, and Septal). The images (above) shows the quantative results of an MP procedure, call a Bull's Eye or Polar Map
- The images are in a color scale that displays color by the amount of activity per pixel. White pixels contain the highest and dark blue/black contain the least least amount of counts
- If the pixel variation is greater than 2.5 SD, then violet, blue or even black would show up within that area of the myocardial map (see below)
- These drastic changes in color represent disease via the lack of activity
- Should a dark region be present in just the stress image (not in the rest), then ischemia is diagnosed
- If the dark area is seen in both stress and redistribution images, then an infarct is indicated
- A myocardial map shows the location of the defect and defines which coronary artery (or arteries) is/are involved
- The above example is considered normal since there is no significant change in color
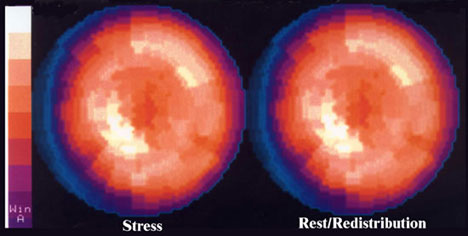
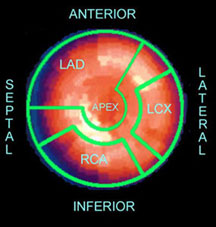
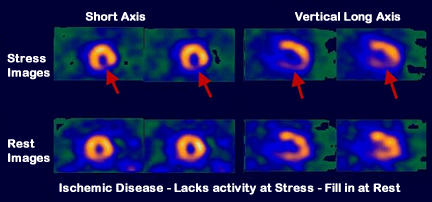
Image modified - Link http://cme.medcomasia.com/cmequiz/quizview.asp?id=443
- Example of stressed-induced ischemia. Why is there a lack of activity on the stress images, yet activity fills in on rest?
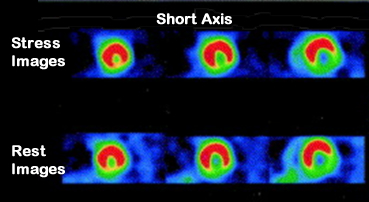
Image modified - http://www.sciencedirect.com/science/article/pii/S1071358103007281 - Example of myocardial infarct. Why is a lack of activity seen in stress and rest images?
- Examples of Abnormal Polar Maps: The images on the left show a lack of activity in the inferior wall in stress, but it fills in on rest. While the images on the right, both stress and rest show a lack of activity that involves the septal wall and apex. Which set of maps represents ischemia and infarct?