for x,y,z all between -3 and 3.
Click here for the .dpg file (in particular, pay attention to the commands view and perspective). The following graph is produced:
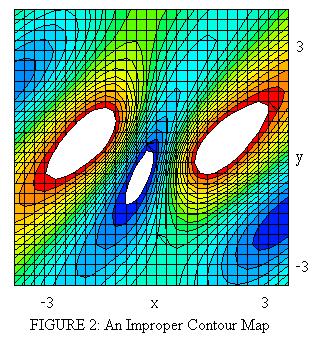
DPGraph's method for creating Figure 1 is simple: It draws the 3D surface that is the graph of z = f(x,y), then following the view:=top and perspective:=false commands, it presents the image as if it is being seen directly from above and without any perspective. To see the full surface for comparison, use the arrow keys on the keyboard to rotate the graph, or change the view to "standard" and perspective to "true".
Note the following:
- The colors have meaning: The more RED a spot, the higher the z-value, the more BLUE the lower the z-value. Hence, the contour map shows two peaks, a valley and parts of two more valleys within the x,y,z range from -3 to 3 (in a larger range, there will be more peaks and valleys becuase the sine function is periodic; however, the heights of peaks and the depths of valleys diminish as we move away from the origin - why?)
- The rectangular grid overlaid on top of the contour diagram is useful in estimating locations of various points on the map; for example, since each grid element is 1/27th of the length of the interval [-3,3] (as determined by the resolution number), i.e., 6/27 = 2/9 units, we estimate the location of the peak on the right to be approximately
x = 3-[(2/9)*7] = 3-(14/9) = 13/9 =
1.44,
y = -3+[(2/9)*14] = -3+(28/9) = 1/9 = 0.11
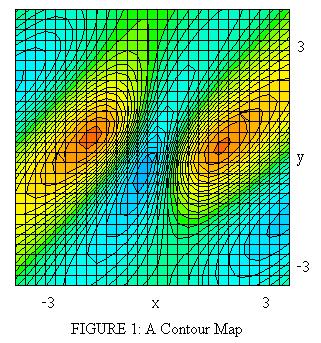
Changing the z range can alter the appearence of a contour map. For instance restricting z to the interval [-2,2] gives the diagram in Figure 2 below. The white regions are areas that are cut off by the DPGraph, since the z values are not adequate to cover the higher peaks and lower valleys. The contour diagram in Figure 2 is, therefore, improper since it has lost important information.